Difference between revisions of "File:Figure 2.3.2.png"
Jump to navigation
Jump to search
(No difference)
|
Latest revision as of 18:18, 27 February 2023
Figure 2.3.2—An example of a summary graph for the 3-year average ozone statistic from the Forest Service Air Resource Management Program website.
File history
Click on a date/time to view the file as it appeared at that time.
| Date/Time | Thumbnail | Dimensions | User | Comment | |
|---|---|---|---|---|---|
| current | 18:18, 27 February 2023 | 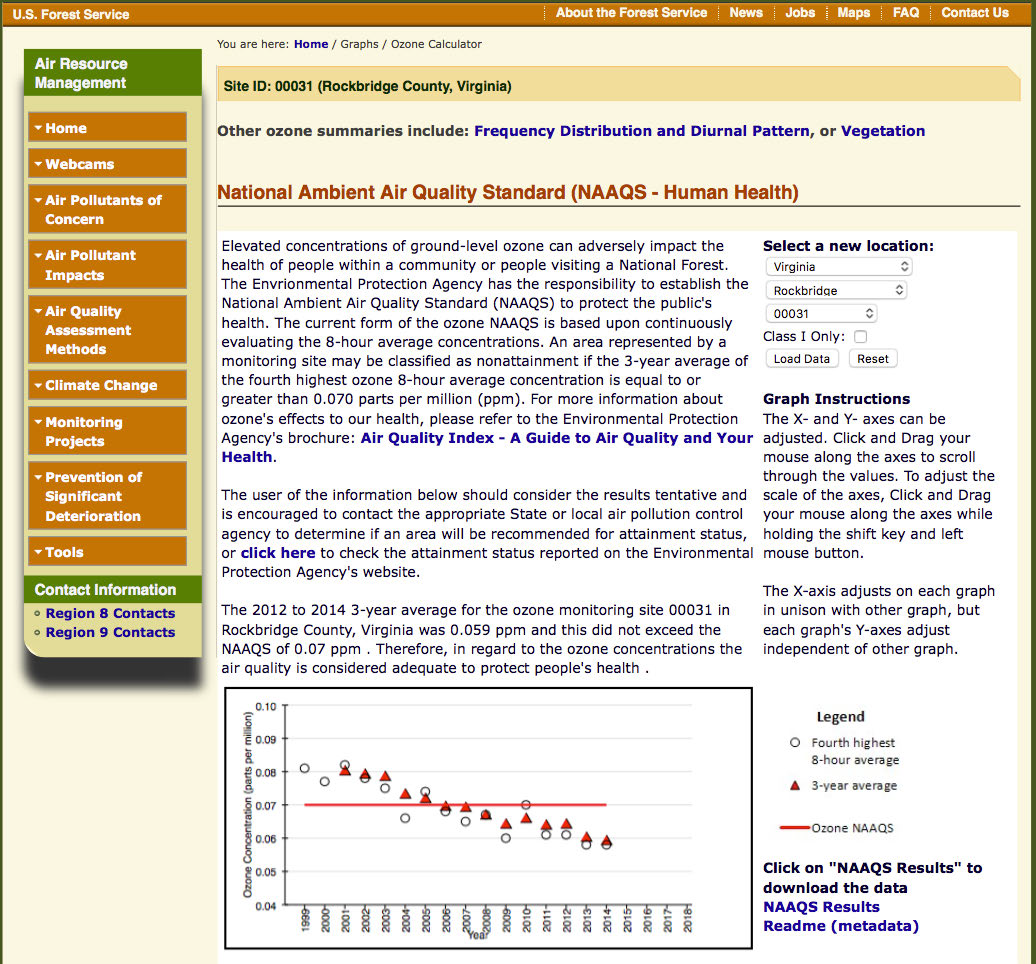 | 1,036 × 964 (831 KB) | Admin (talk | contribs) |
You cannot overwrite this file.
File usage
The following page uses this file: