Help
File list
Jump to navigation
Jump to search
This special page shows all uploaded files.
File list
Items per page:
20
50
100
250
500
Search for media name:
Username:
Include old versions of files
Go
First page
Previous page
Next page
Last page
Date
Name
Thumbnail
Size
User
Description
Versions
18:51, 1 March 2023
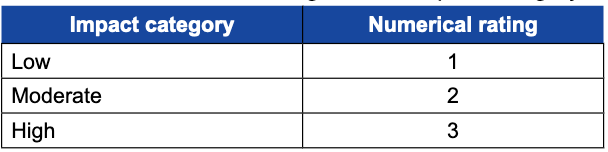
Table 2.3.4—Numerical ratings for the impact category of nonindigenous terrestrial animal species..png
(
file
)
14 KB
Admin
1
19:07, 1 March 2023
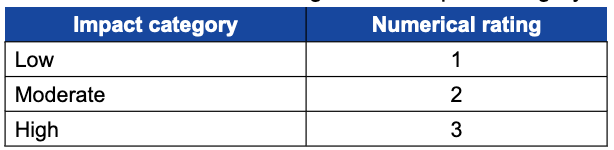
Table 2.3.8—Numerical ratings for the impact category of nonindigenous aquatic animal species..png
(
file
)
14 KB
Admin
1
23:34, 1 March 2023
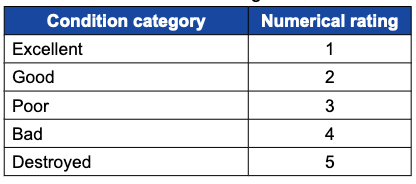
Table 2.6.5—Recommended framework for developing condition categories and numerical ratings for other features of value..png
(
file
)
15 KB
Admin
1
23:37, 1 March 2023
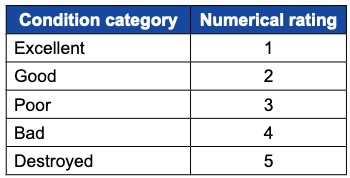
Table 2.6.2—Numerical rating for the condition category of integral cultural features..png
(
file
)
15 KB
Admin
1
21:51, 2 March 2023
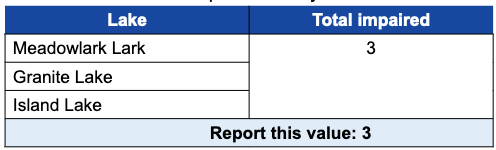
Table 2.3.19—An example summary of the number of lakes with impaired water quality..png
(
file
)
15 KB
Admin
1
21:51, 2 March 2023
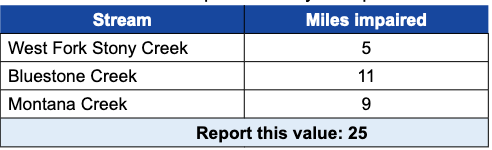
Table 2.3.18—An example summary of impaired miles of streams..png
(
file
)
18 KB
Admin
1
19:06, 1 March 2023
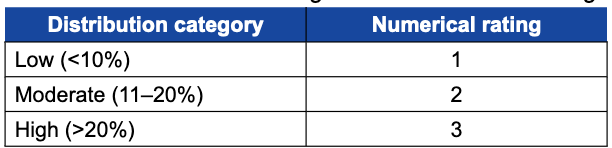
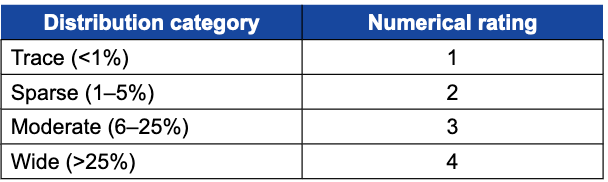
Table 2.3.7—Numerical ratings for the distribution category of nonindigenous aquatic animal species..png
(
file
)
19 KB
Admin
1
22:50, 1 March 2023
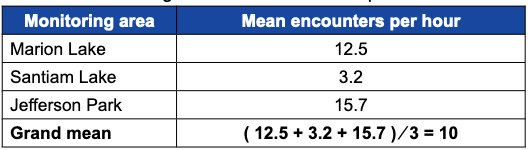
Table 2.5.3—Example of computing the grand mean number of traveling encounters per hour based on data collected using the national minimum protocol..png
(
file
)
20 KB
Admin
1
23:10, 1 March 2023
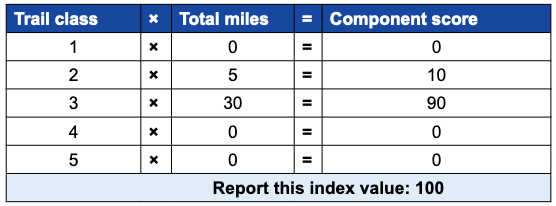
Table 2.5.15—An example of how to calculate the index of NFS trails for a wilderness..png
(
file
)
22 KB
Admin
1
22:51, 1 March 2023
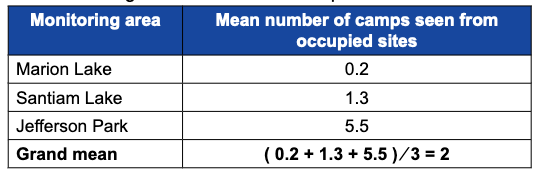
Table 2.5.4—Example of computing the grand mean number of camp encounters based on data collected using the national minimum protocol..png
(
file
)
23 KB
Admin
1
18:51, 1 March 2023
Table 2.3.3.png
(
file
)
23 KB
Admin
1
22:06, 1 March 2023
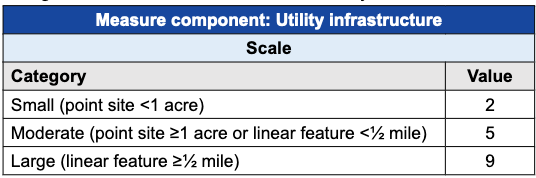
Table 2.4.7—Element categories and numerical values used to calculate individual development ratings for features tracked under the utility infrastructure measure component..png
(
file
)
25 KB
Admin
1
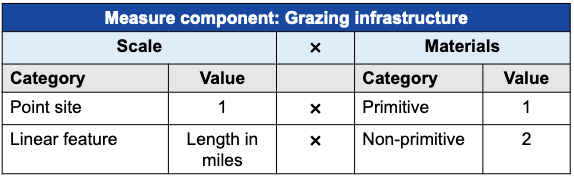
22:13, 1 March 2023
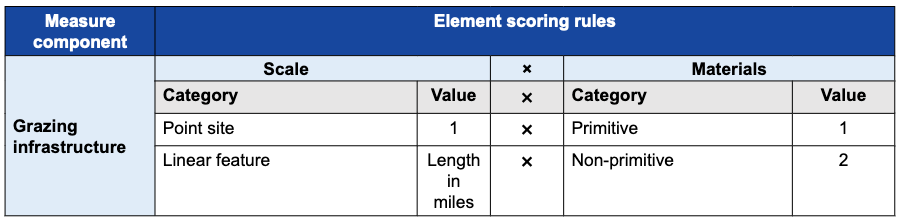
Table 2.4.9—Element categories and numerical values used to calculate individual development ratings for features tracked under the grazing infrastructure measure component..png
(
file
)
26 KB
Admin
1
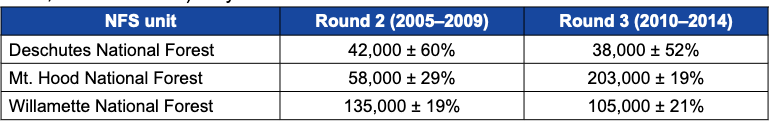
22:54, 1 March 2023
Table 2.5.6—NVUM estimates of wilderness visits for three Region 6 National Forests (Deschutes, Mt. Hood, and Willamette) for years 2005–2009 and 2010–2014..png
(
file
)
27 KB
Admin
1
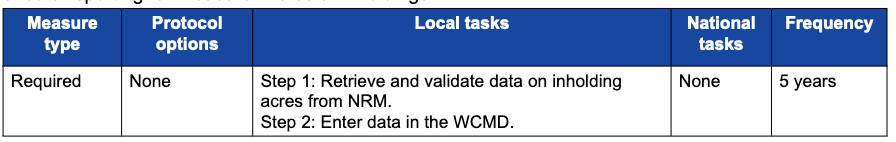
22:14, 1 March 2023
Table 2.4.10—Summary of measure type, protocol options, local tasks, national tasks, and frequency of data reporting for measure "Acres of Inholdings.".png
(
file
)
29 KB
Admin
1
22:57, 1 March 2023
Table 2.5.8—An example of how to calculate the index of recreation sites for a wilderness..png
(
file
)
30 KB
Admin
1
21:46, 1 March 2023
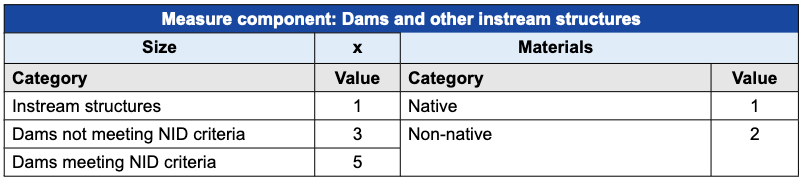
Table 2.4.5—Element categories and numerical values used to calculate individual development ratings for features tracked under the dams and other instream structures measure component..png
(
file
)
30 KB
Admin
1
22:09, 1 March 2023
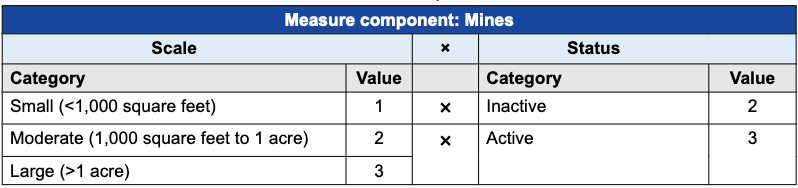
Table 2.4.8—Element categories and numerical values used to calculate individual development ratings for features tracked under the mines measure component..png
(
file
)
30 KB
Admin
1
21:07, 1 March 2023
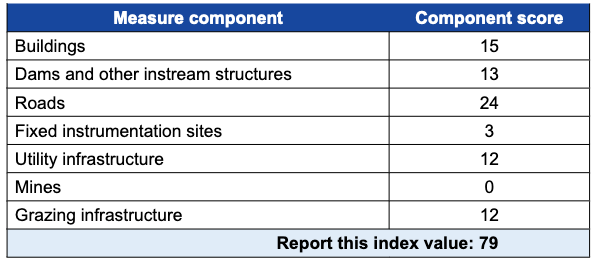
Table 2.4.3—An example of how to calculate the development index value for a wilderness..png
(
file
)
33 KB
Admin
1
21:05, 1 March 2023
Table 2.4.2—Summary table2 of the scoring rules for all seven measure components..png
(
file
)
36 KB
Admin
1
23:14, 1 March 2023
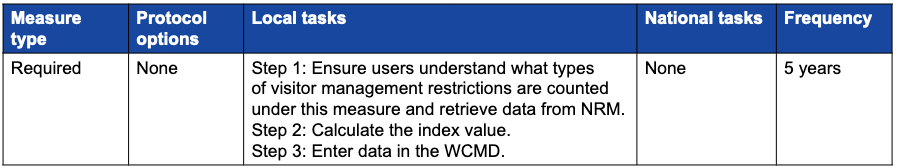
Table 2.5.17—Summary of measure type, protocol options, local tasks, national tasks, and frequency of data reporting for measure "Index of Visitor Management Restrictions.".png
(
file
)
39 KB
Admin
1
22:26, 1 March 2023
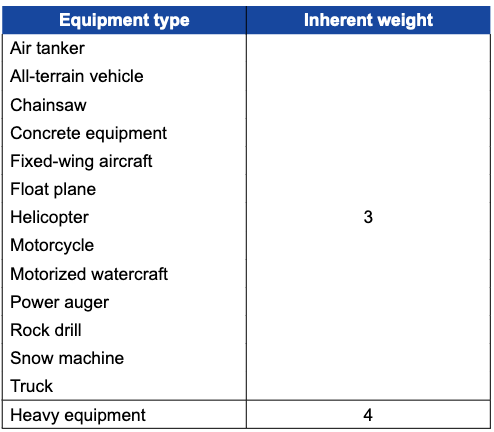
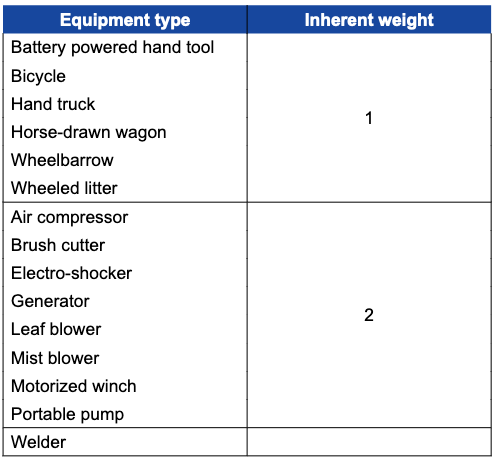
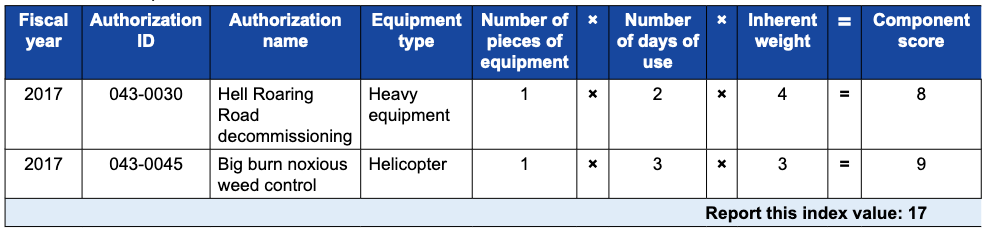
Table 2.4.17—Inherent weights of different types of motorized equipment and mechanical transport used in wilderness2..png
(
file
)
39 KB
Admin
1
16:39, 1 March 2023
Table 1.1.11.png
(
file
)
39 KB
Admin
1
16:40, 1 March 2023
Table 1.1.12.png
(
file
)
39 KB
Admin
1
16:39, 1 March 2023
Table 1.1.10.png
(
file
)
40 KB
Admin
1
16:38, 1 March 2023
Table 1.1.9.png
(
file
)
40 KB
Admin
1
23:03, 1 March 2023
Table 2.5.11—Summary of measure type, protocol options, local tasks, national tasks, and frequency of data reporting for measure "Miles of Unauthorized Trails.".png
(
file
)
41 KB
Admin
1
21:15, 1 March 2023
Table 2.4.4—Element categories and numerical values used to calculate individual development ratings for features tracked under the buildings measure component..png
(
file
)
41 KB
Admin
1
22:48, 1 March 2023
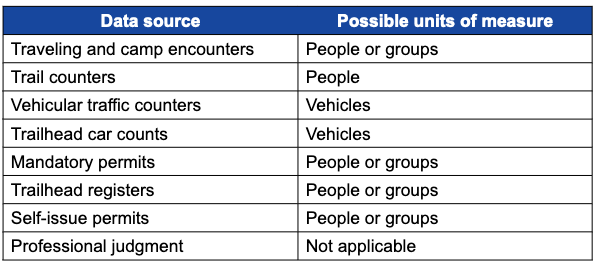
Table 2.5.2—Choices for units of measure for encounters and visitation..png
(
file
)
41 KB
Admin
1
23:38, 1 March 2023
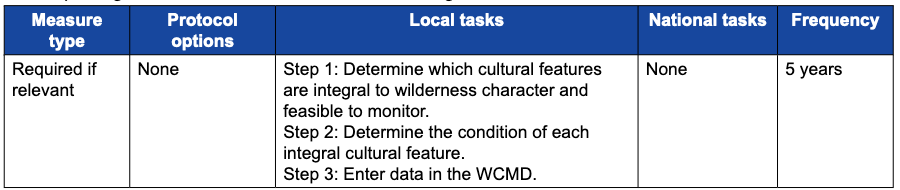
Table 2.6.1—Summary of measure type, protocol options, local tasks, national tasks, and frequency of data reporting for measure "Condition Index for Integral Cultural Features.".png
(
file
)
41 KB
Admin
1
23:35, 1 March 2023
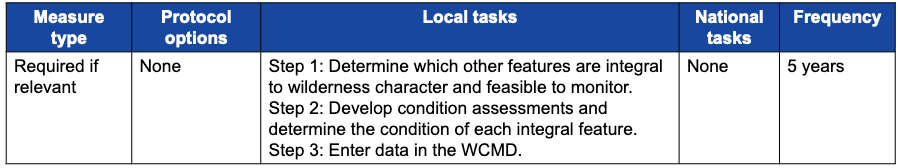
Table 2.6.4—Summary of measure type, protocol options, local tasks, national tasks, and frequency of data reporting for measure "Condition Index for Other Features.".png
(
file
)
41 KB
Admin
1
22:56, 1 March 2023
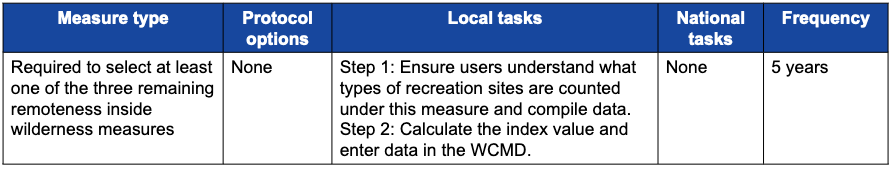
Table 2.5.7—Summary of measure type, protocol options, local tasks, national tasks, and frequency of data reporting for measure "Index of Recreation Sites within Primary Use Areas.".png
(
file
)
41 KB
Admin
1
23:09, 1 March 2023
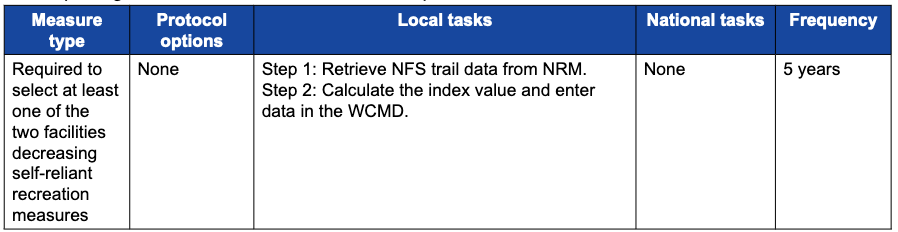
Table 2.5.14—Summary of measure type, protocol options, local tasks, national tasks, and frequency of data reporting for measure "Index of NFS Developed Trails.".png
(
file
)
42 KB
Admin
1
22:25, 1 March 2023
Table 2.4.17—Inherent weights of different types of motorized equipment and mechanical transport used in wilderness..png
(
file
)
43 KB
Admin
1
21:57, 2 March 2023
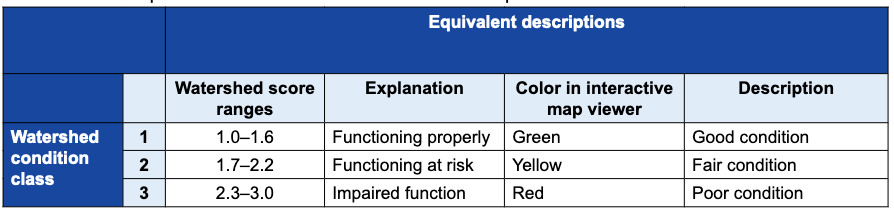
Table 2.3.21—Equivalent watershed condition class descriptions..png
(
file
)
43 KB
Admin
1
22:24, 1 March 2023
Table 2.4.16.png
(
file
)
44 KB
Admin
1
22:20, 1 March 2023
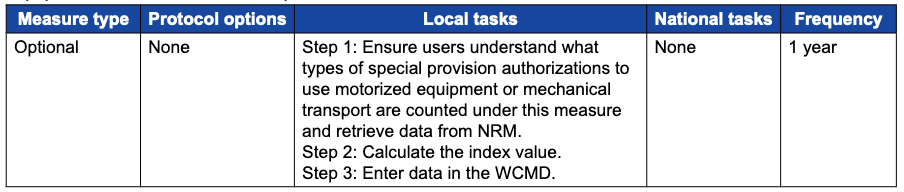
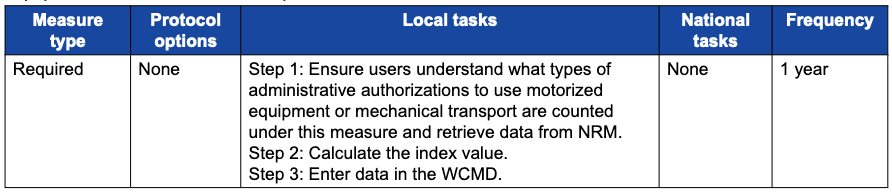
Table 2.4.14—Summary of measure type, protocol options, local tasks, national tasks, and frequency of data reporting for measure "Percent of Emergency Incidents Using Motor Vehicles, Motorized Equipment, or Mechanical Transport.".png
(
file
)
45 KB
Admin
1
22:17, 1 March 2023
Table 2.4.11.png
(
file
)
45 KB
Admin
1
21:58, 2 March 2023
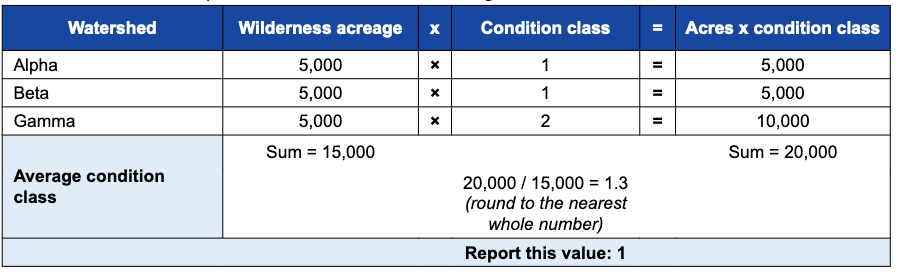
Table 2.3.22—An example of how to calculate the average wilderness condition class..png
(
file
)
46 KB
Admin
1
23:11, 1 March 2023
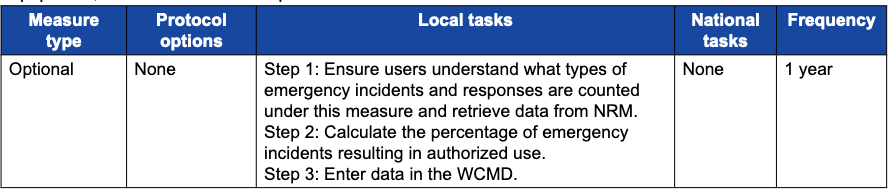
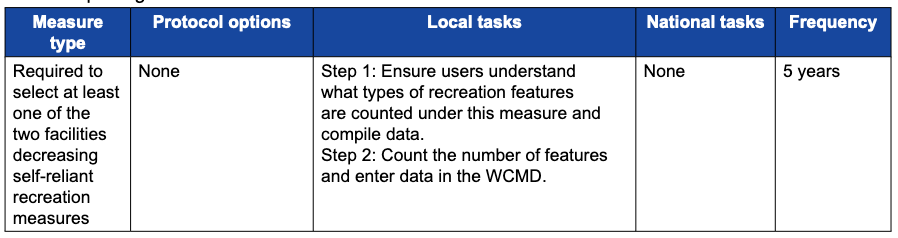
Table 2.5.16—Summary of measure type, protocol options, local tasks, national tasks, and frequency of data reporting for measure "Number of Authorized Constructed Recreation Features.".png
(
file
)
48 KB
Admin
1
15:57, 1 March 2023
Table 1.1.7.png
(
file
)
50 KB
Admin
1
23:05, 1 March 2023
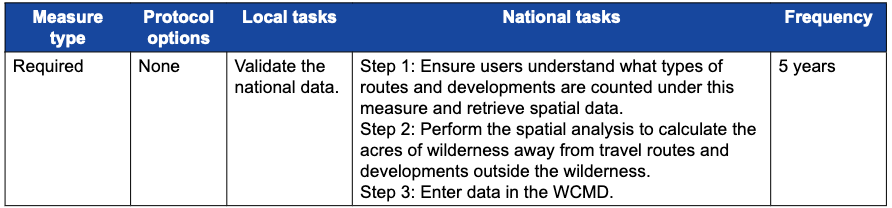
Table 2.5.12—Summary of measure type, protocol options, local tasks, national tasks, and frequency of data reporting for the measure "Acres of Wilderness Away from Adjacent Travel Routes and Developments Outside the Wilderness.".png
(
file
)
51 KB
Admin
1
22:52, 1 March 2023
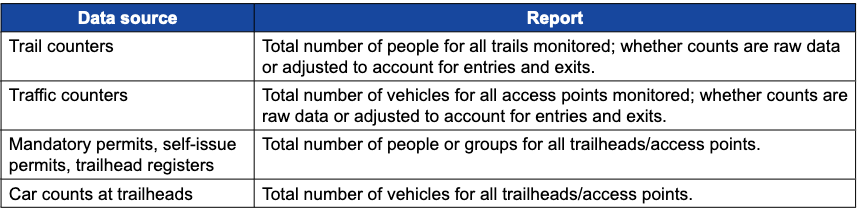
Table 2.5.5—Values to report for various data sources used for indirect measures for the index of encounters.png
(
file
)
51 KB
Admin
1
21:51, 1 March 2023
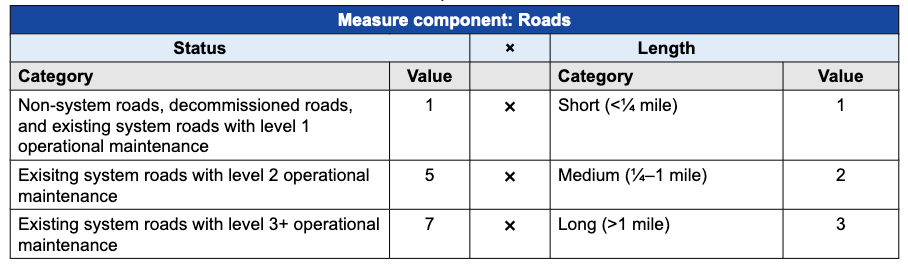
Table 2.4.6—Element categories and numerical values used to calculate individual development ratings for features tracked under the roads measure component..png
(
file
)
51 KB
Admin
1
22:19, 1 March 2023
Table 2.4.13—Example of use-level index calculation for administrative motor vehicle, motorized equipment, and mechanical transport..png
(
file
)
52 KB
Admin
1
20:25, 1 March 2023
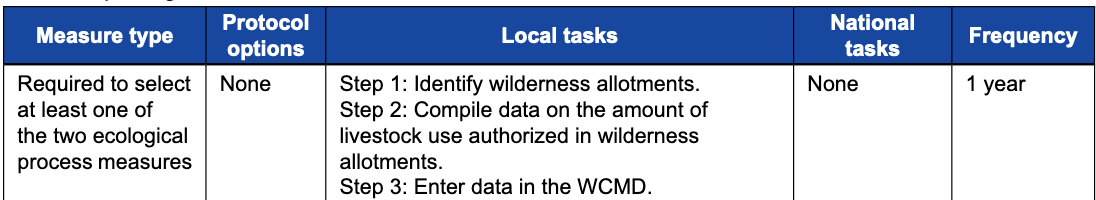
Table 2.3.23—Summary of measure type, protocol options, local tasks, national tasks, and frequency of data reporting for the measure "Number of Animal Unit Months of Commercial Livestock Use.".png
(
file
)
52 KB
Admin
1
18:30, 1 March 2023
T2.2.2.pdf.png
(
file
)
53 KB
Admin
1
19:16, 1 March 2023
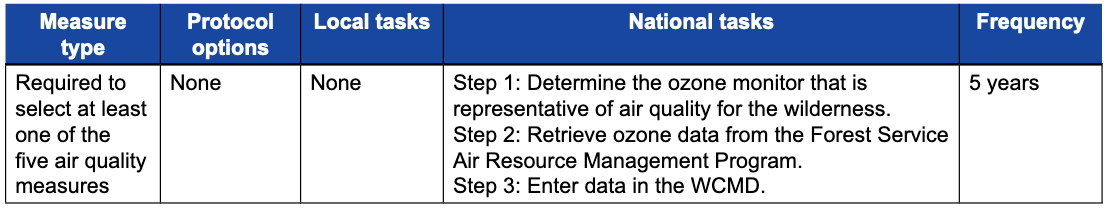
Table 2.3.11—Summary of measure type, protocol options, local tasks, national tasks, and frequency of data reporting for measure "Concentration of Ambient Ozone.".png
(
file
)
54 KB
Admin
1
21:53, 2 March 2023
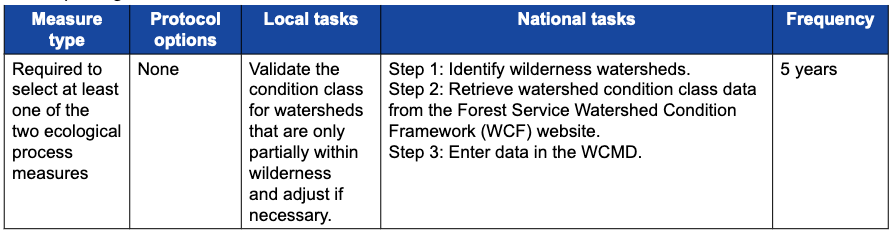
Table 2.3.20—Summary of measure type, protocol options, local tasks, national tasks, and frequency of data reporting for measure "Watershed Condition Class.".png
(
file
)
55 KB
Admin
1
18:31, 1 March 2023
T2.2.3.pdf.png
(
file
)
55 KB
Admin
1
First page
Previous page
Next page
Last page
Navigation menu
Personal tools
Create account
Log in
Namespaces
Special page
Variants
Views
More
Search
Navigation
Main page
Recent changes
Tools
Special pages
Printable version


_for_years_2005%E2%80%932009_and_2010%E2%80%932014..png)