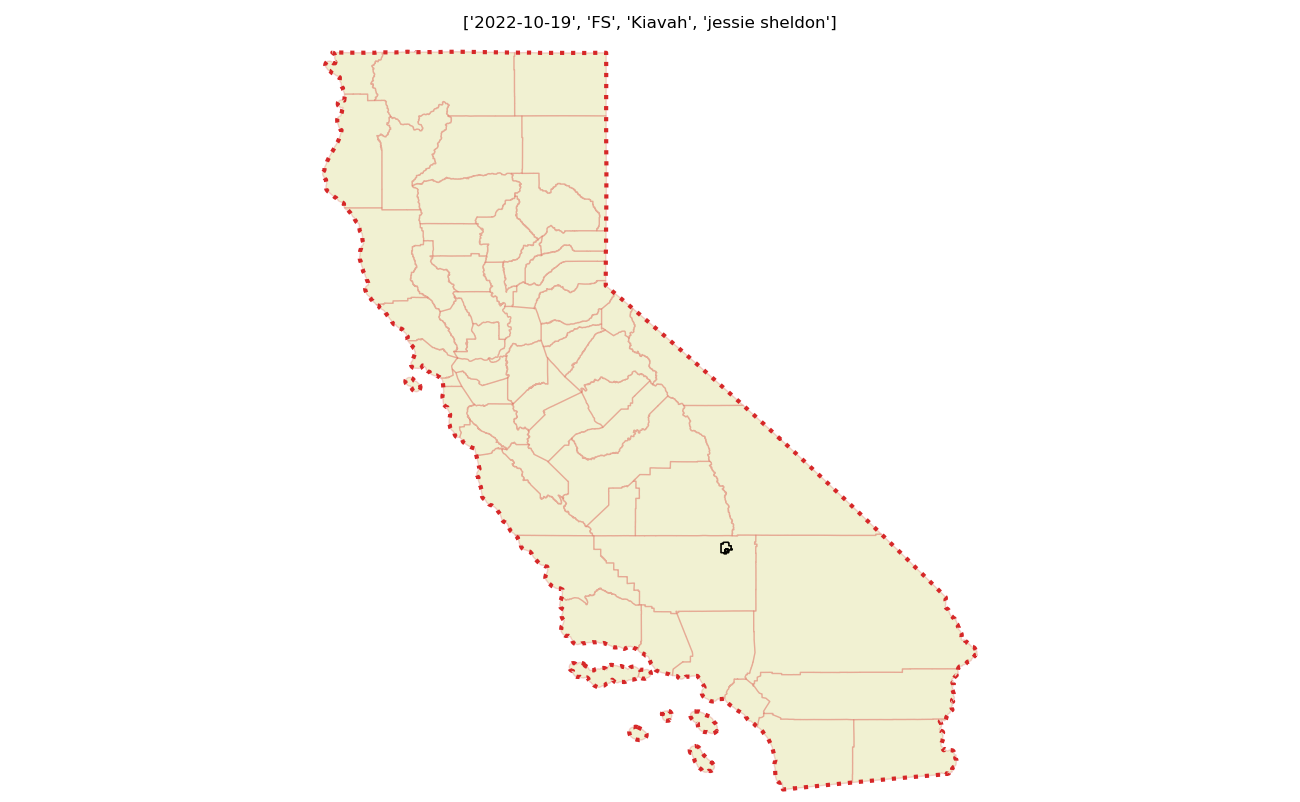
Kiavah Wilderness
Wilderness Area and Surrounding Landscape
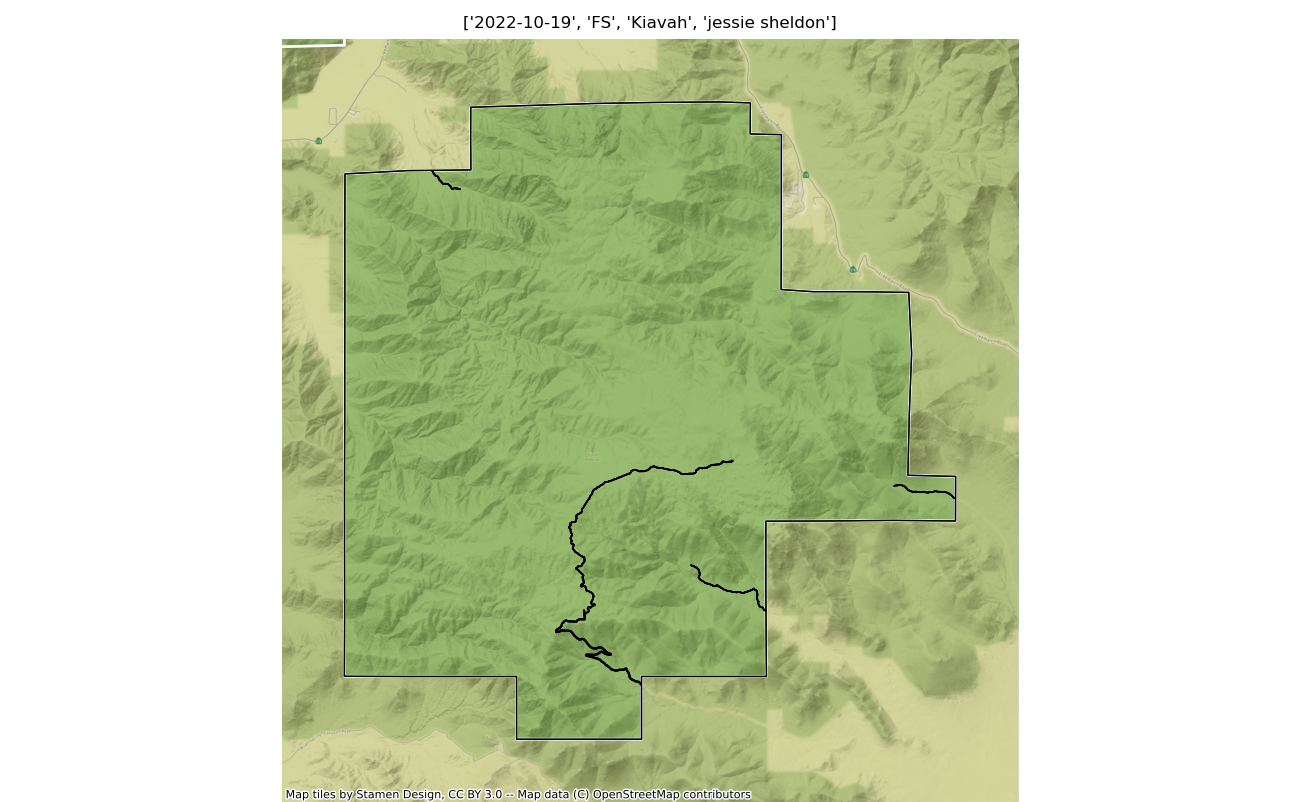
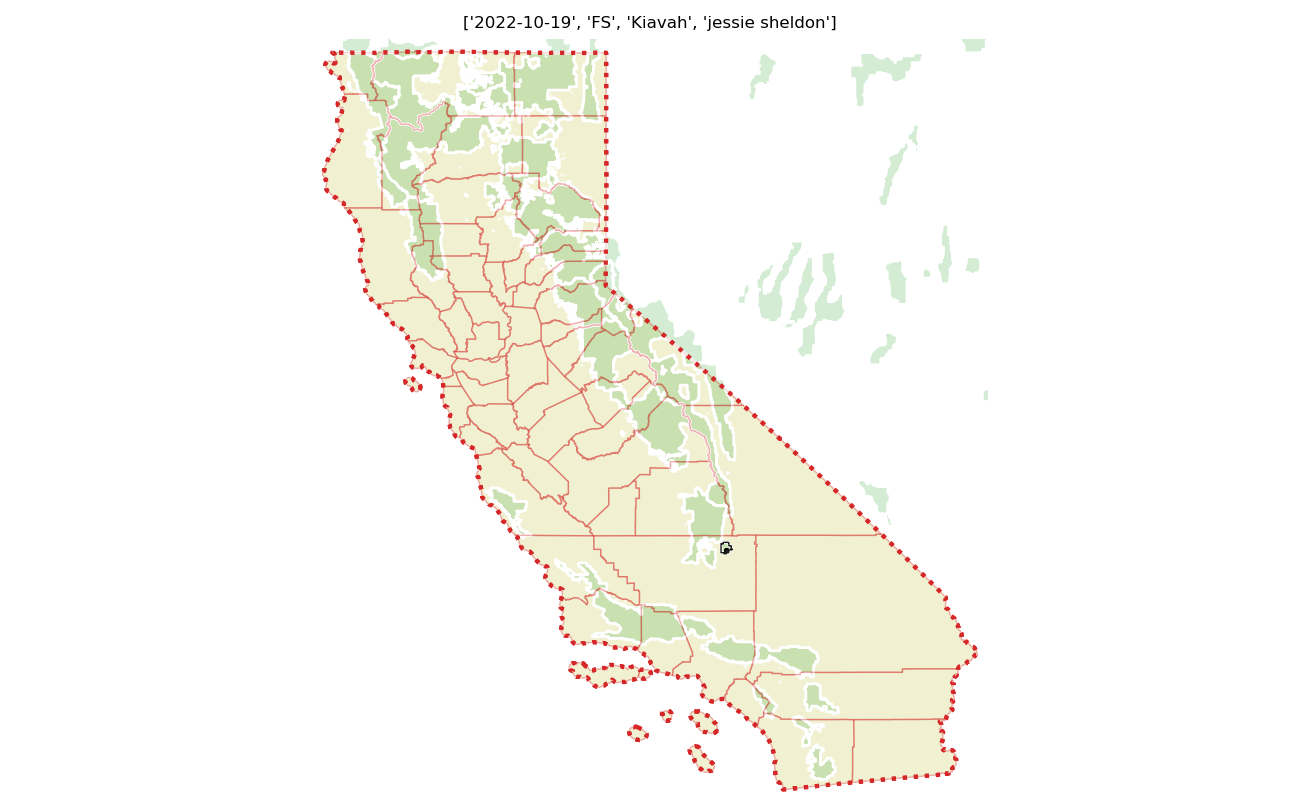
The 45245 acre Kiavah was designated as a National Wilderness on or around 1994-01-01, and Wilderness Character Monitoring baseline work was done in 2023. The maps in this section are made with USFS data, with terrain maps from the internet.
Map and trend graphics on this page were produced on 2023-08-21 as part of the baseline Wilderness Character Monitoring assessment.
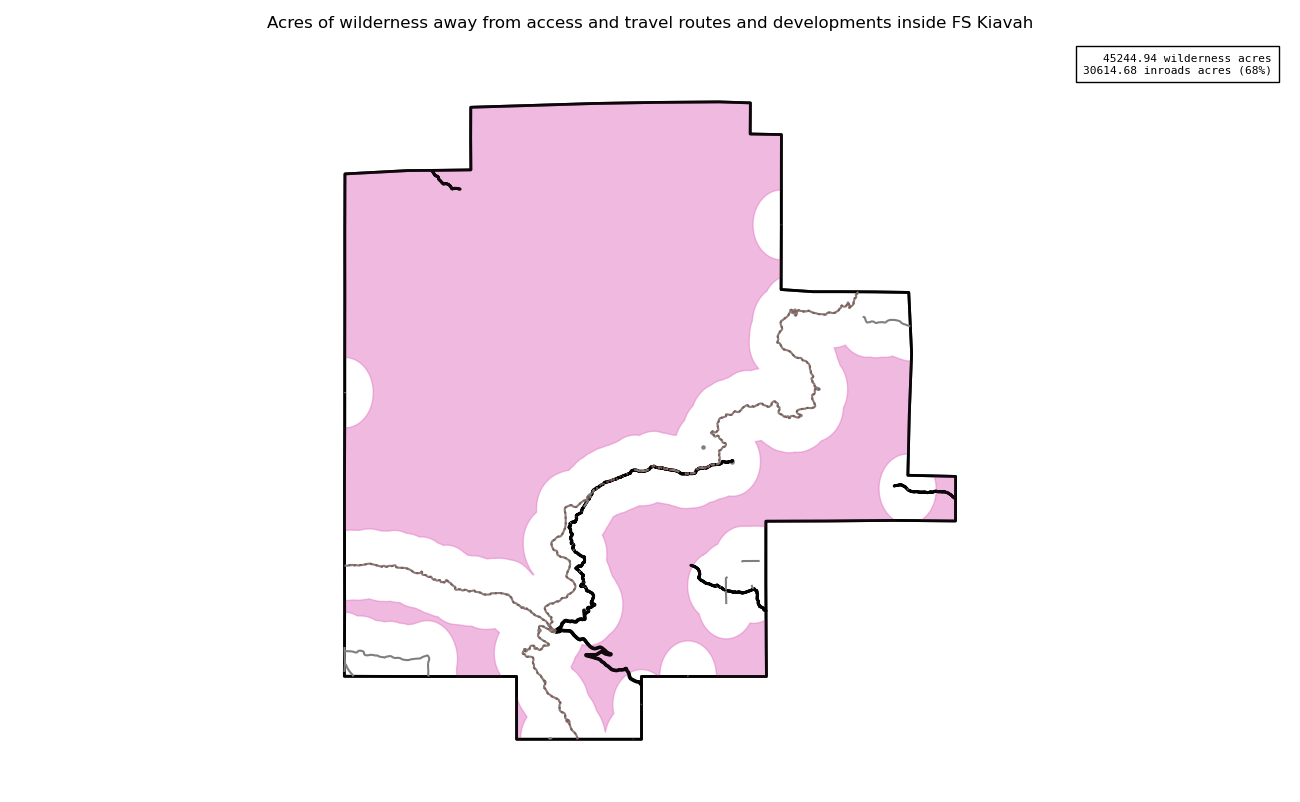
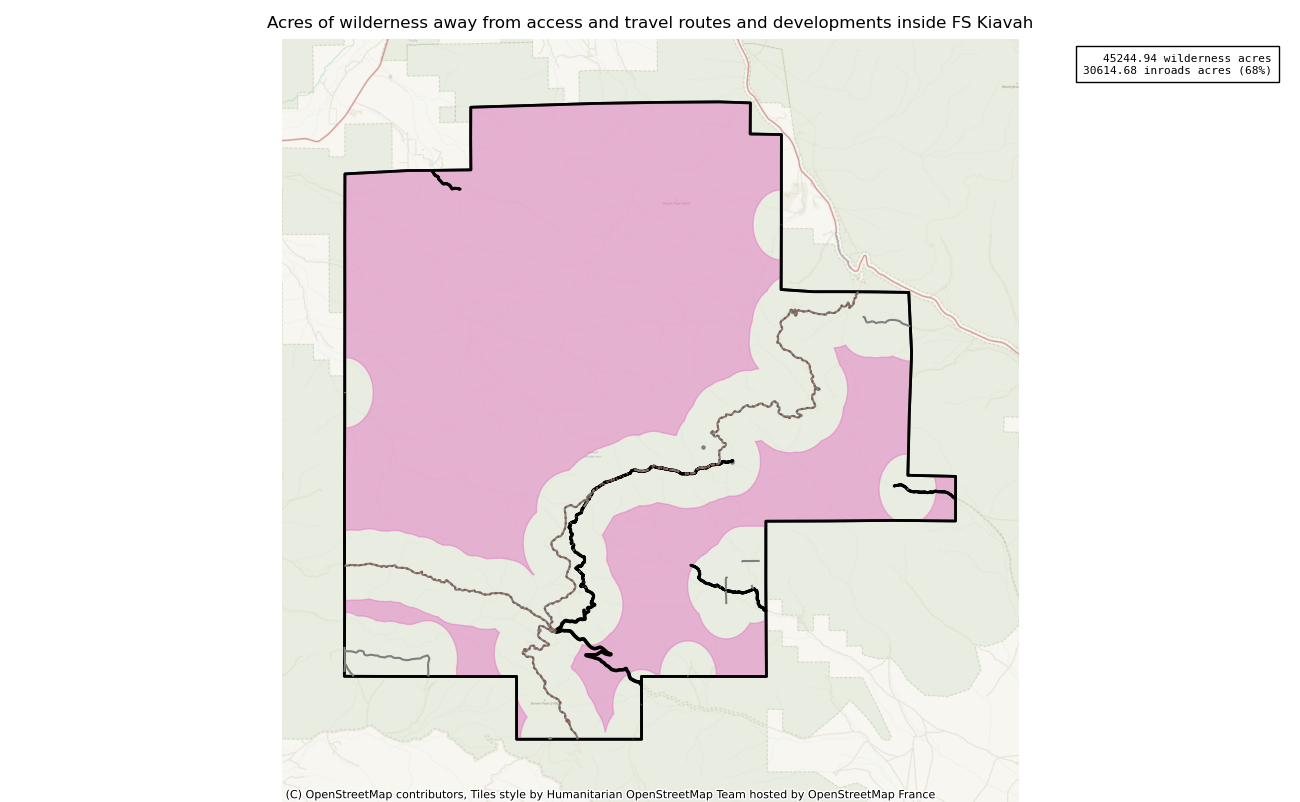
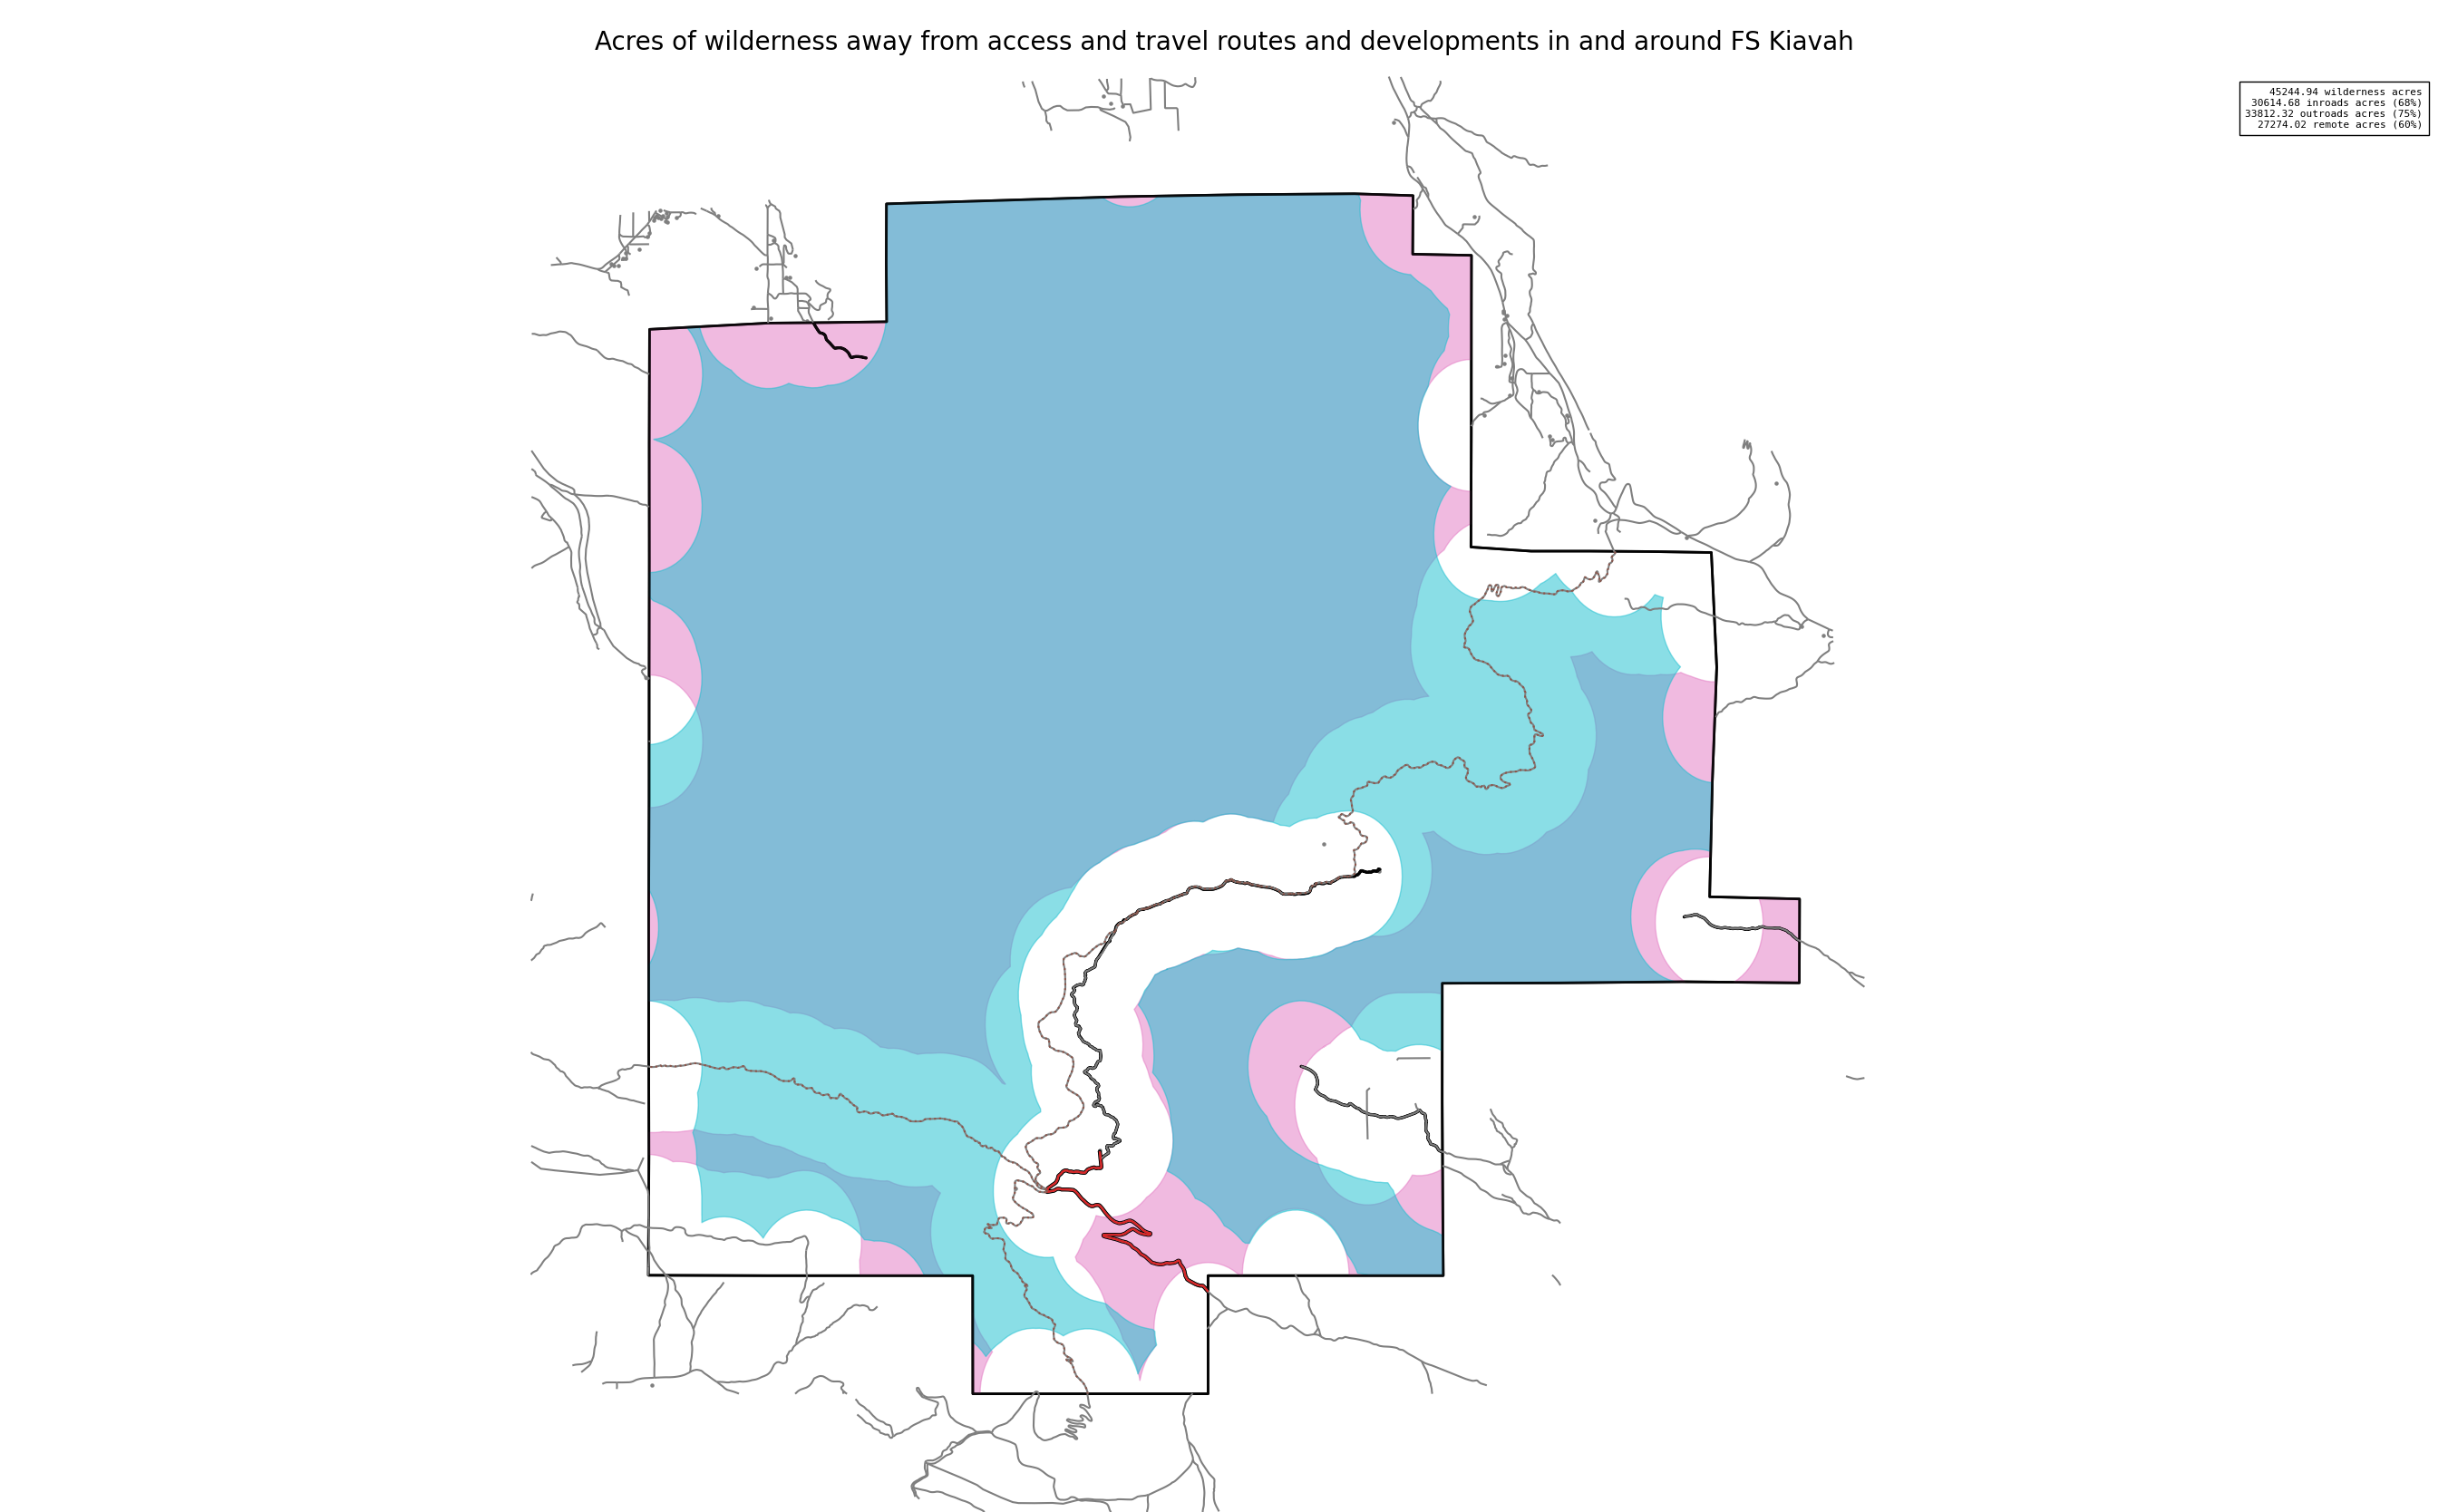
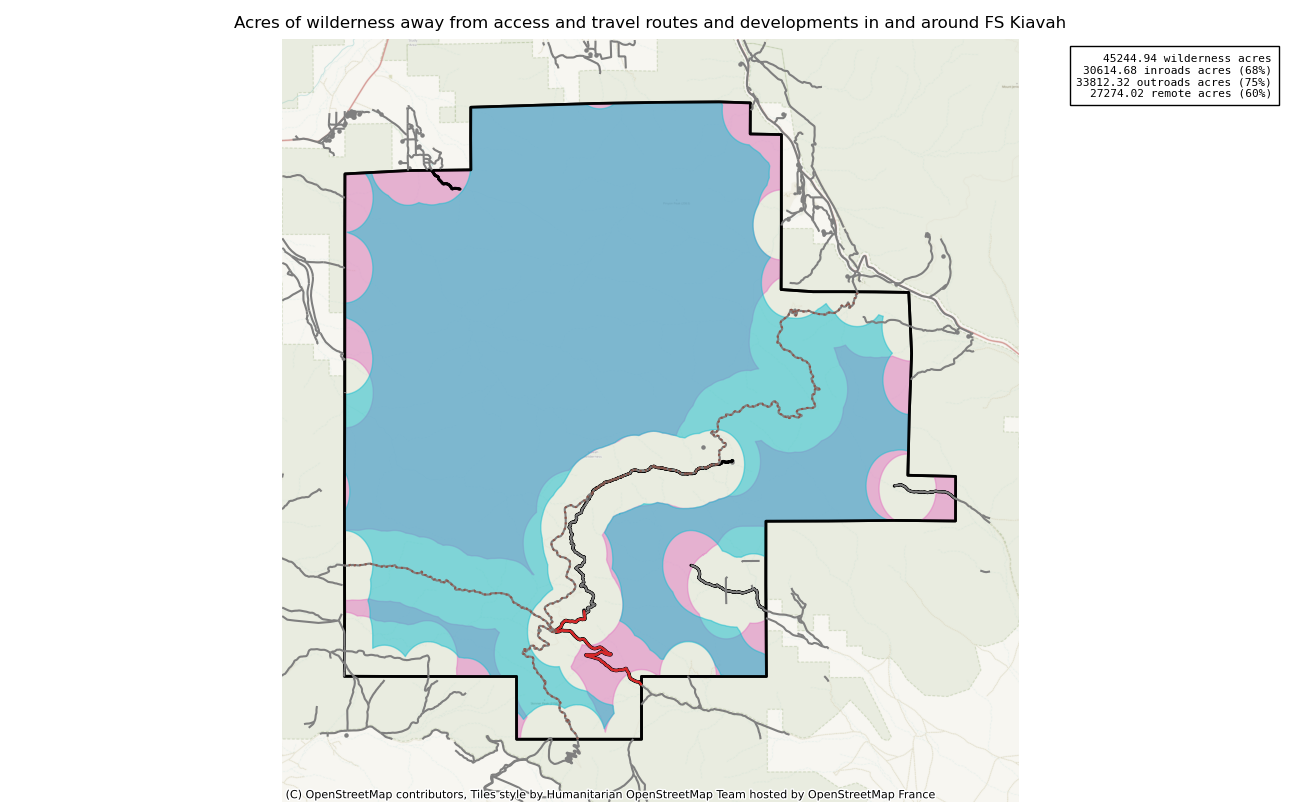
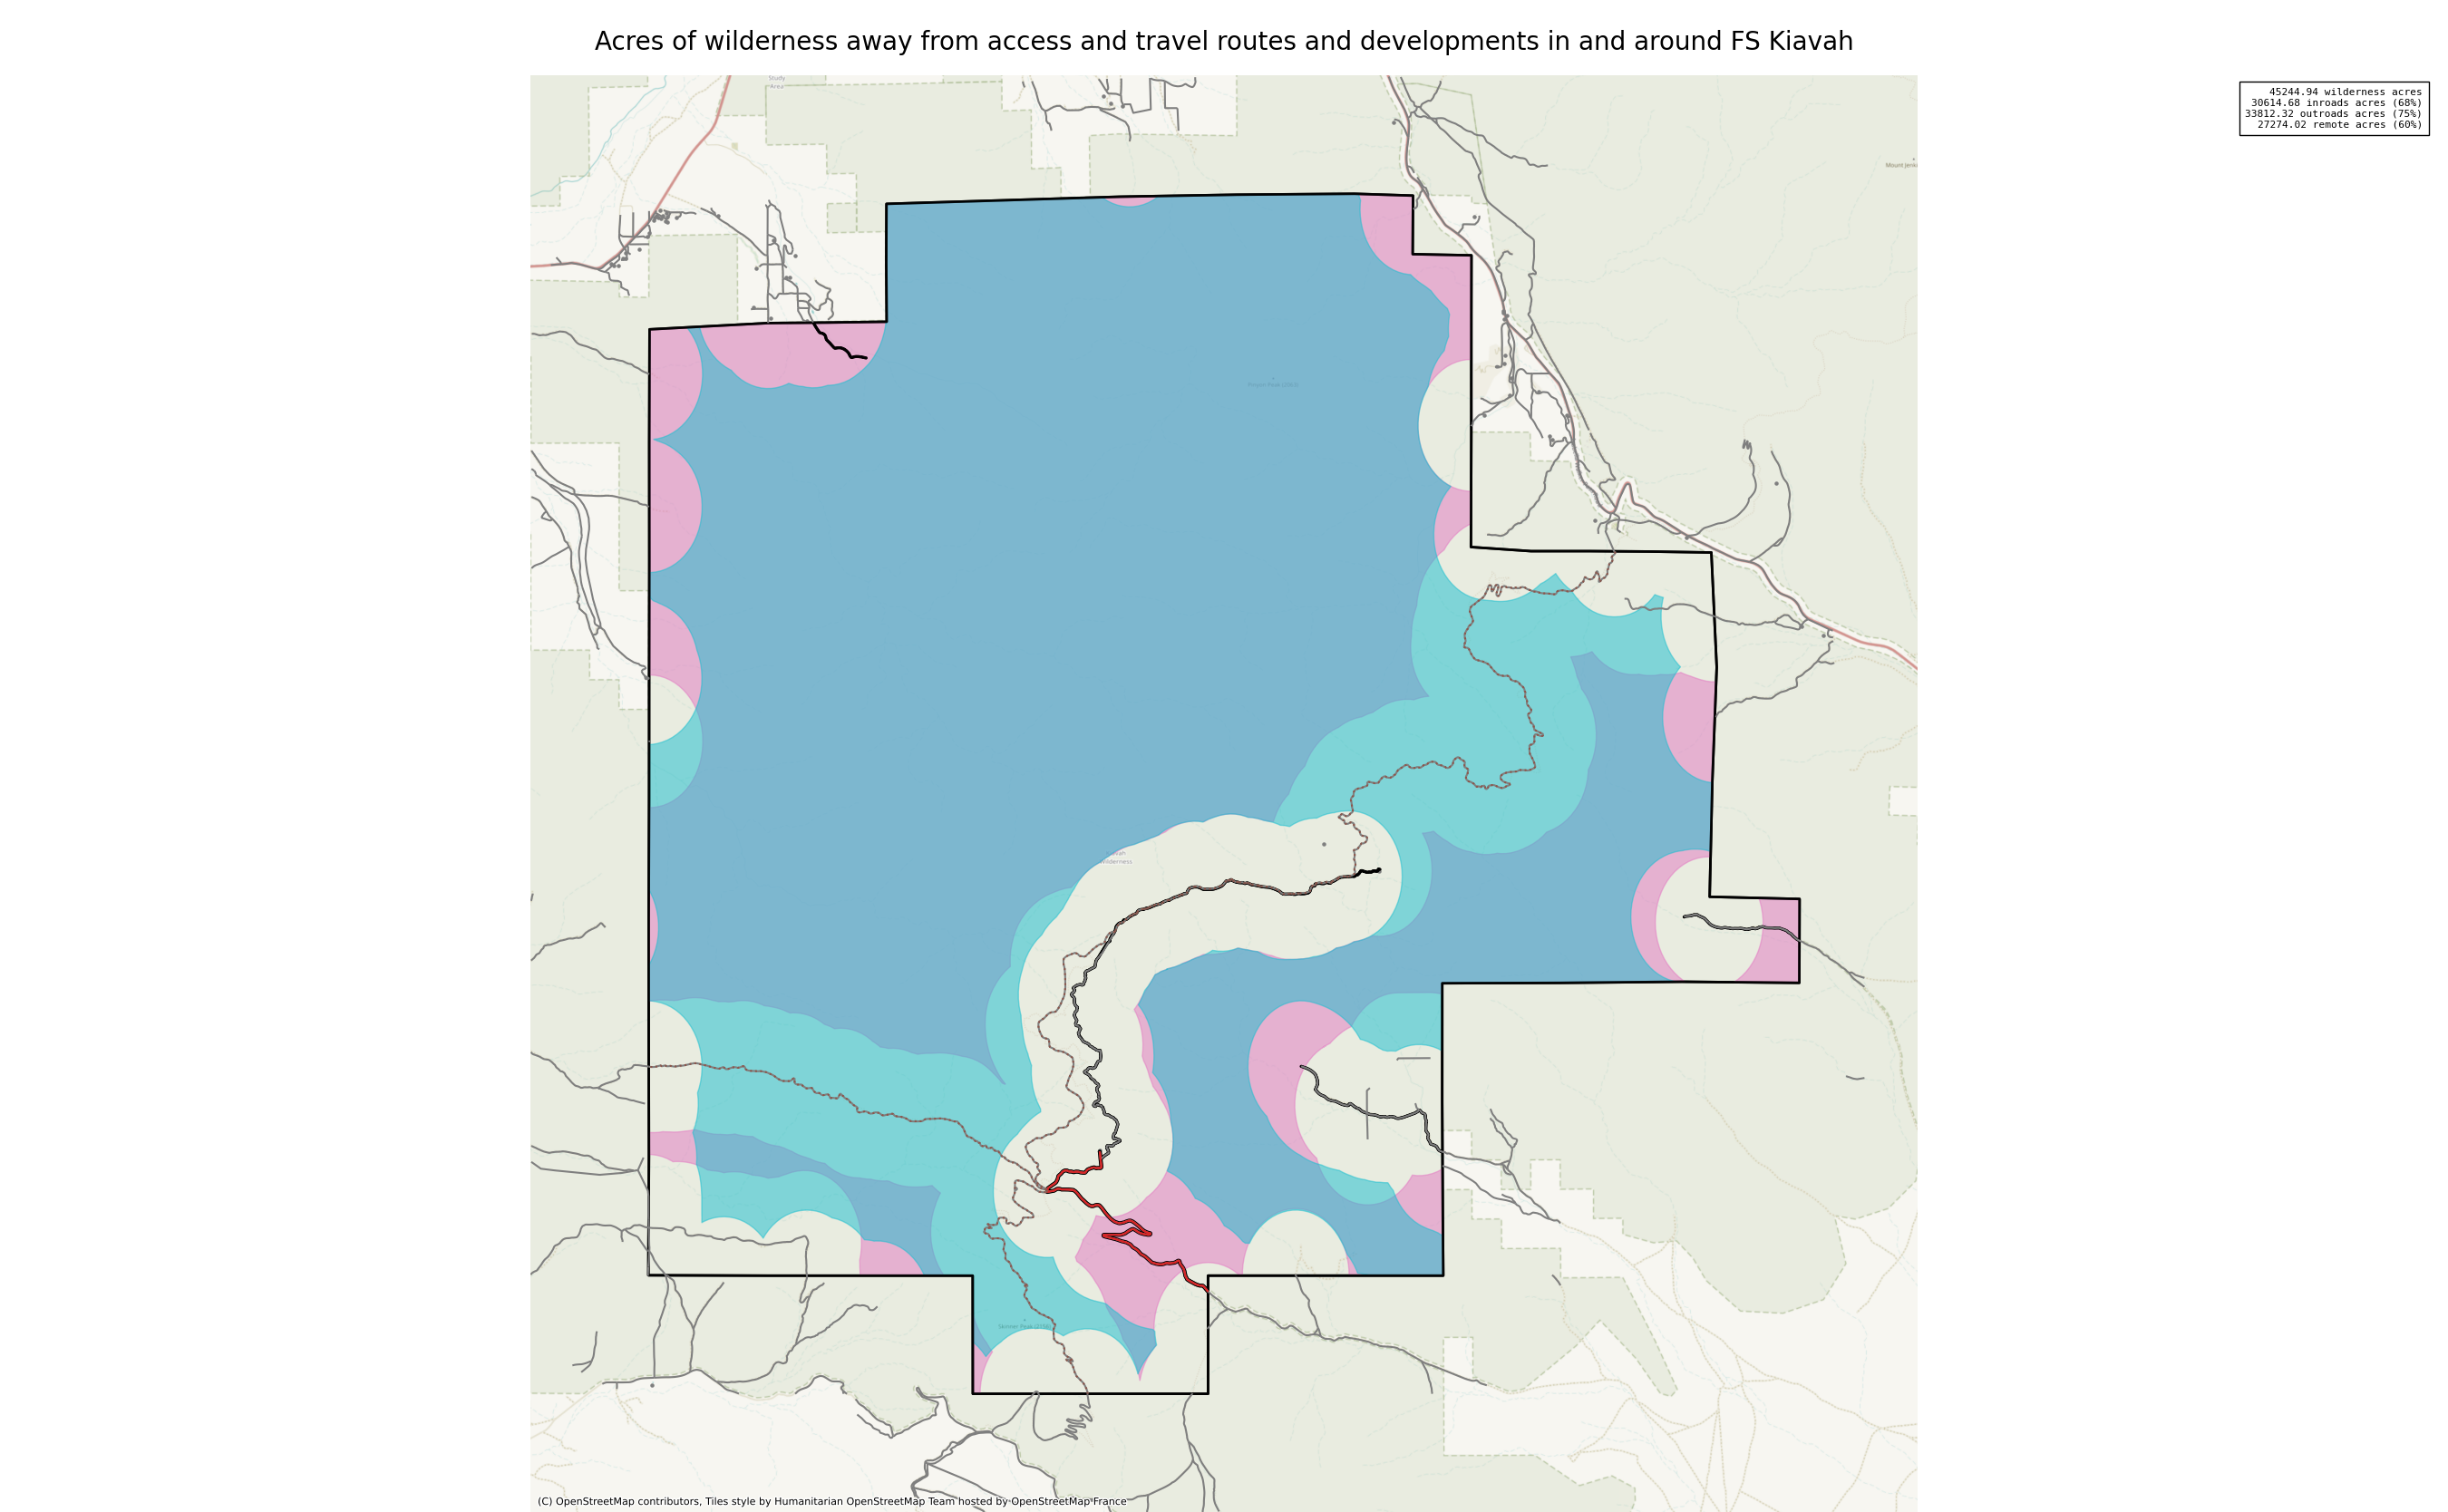
Acres of Wilderness Away from Access and Travel Routes and Developments Inside Wilderness
Developments inside the wilderness are available as kiavah-rem-in-devpt.json, kiavah-rem-in-devln.json, and kiavah-rem-in-trails.json.
Developments in and around the wilderness are available as kiavah_devpt.json, kiavah_devln.json, kiavah_roadcore2.json, and kiavah_trails.json.
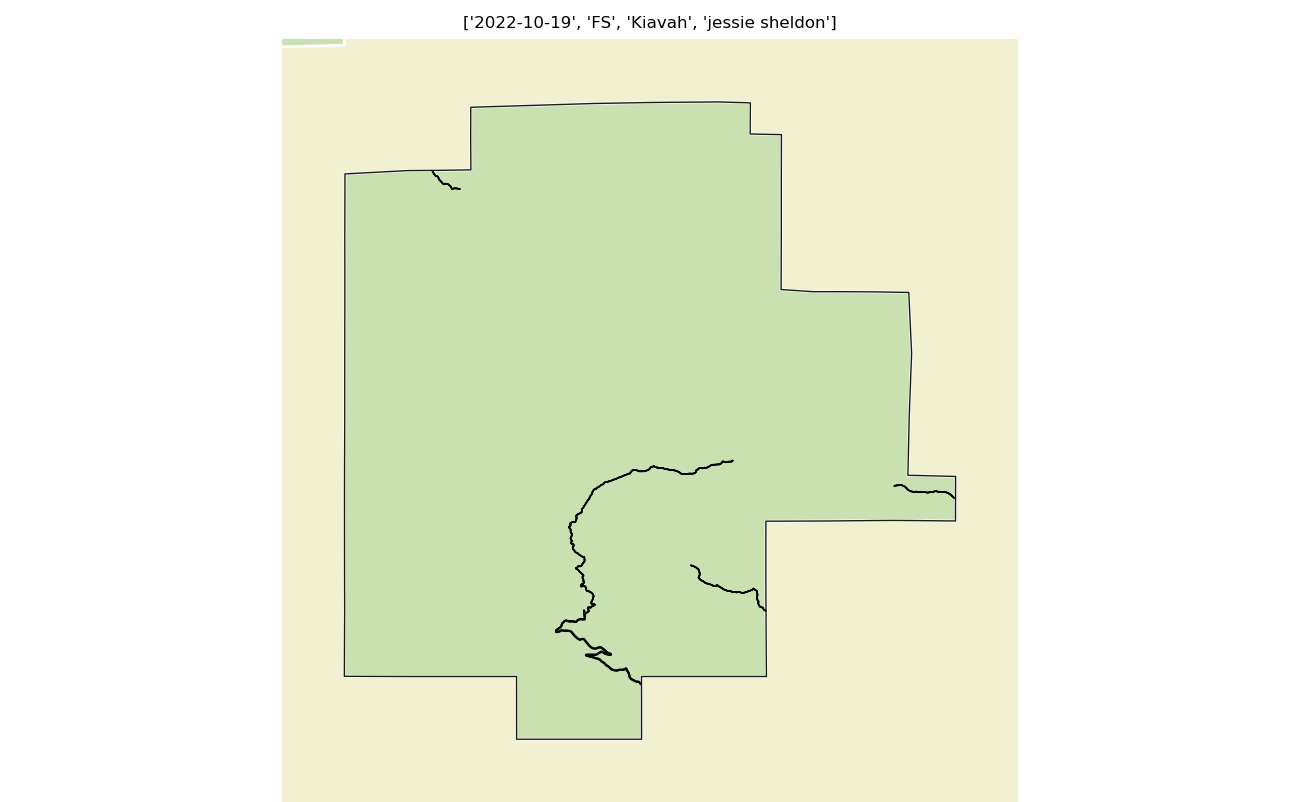
This measure assesses the total number of wilderness acres located more than 1/2 mile from access points, travel routes (authorized trails and roads, aircraft landing sites), and developments inside wilderness. Extent of visitation can have a negative impact on the capacity of a wilderness setting to allow for escape from the sights and sounds of human activity. Most wilderness use concentrates within a few miles of trailheads and access points, especially where day use makes up most of the visitation. Therefore, remote locations away from trails and structures within a wilderness provide opportunities for visitors to find solitude.
Route and development data is from current USFS enterprise data, and should be verified locally before inclusion in any analysis. Corrections to this map reflecting deletions and additions to these may be required in any given year.
Note that roads and developments located exactly on the wilderness boundary are included in the 'remoteness away from development outside wilderness' measure below. Spatial data resolution and accuracy can vary greatly across sources, and determining the intersection of a road represented by a single infinitely thin line can produce incorrect results. These should always be verified locally and corrected.
Once we have a reasonably accurate representation of developments around the wilderness, these are clipped to the wilderness boundary, buffered to half a mile, and these areas are subtracted from the total wilderness area. This initial acreage is the baseline value. The measure is recalculated using current data sources every five years to determine a trend.
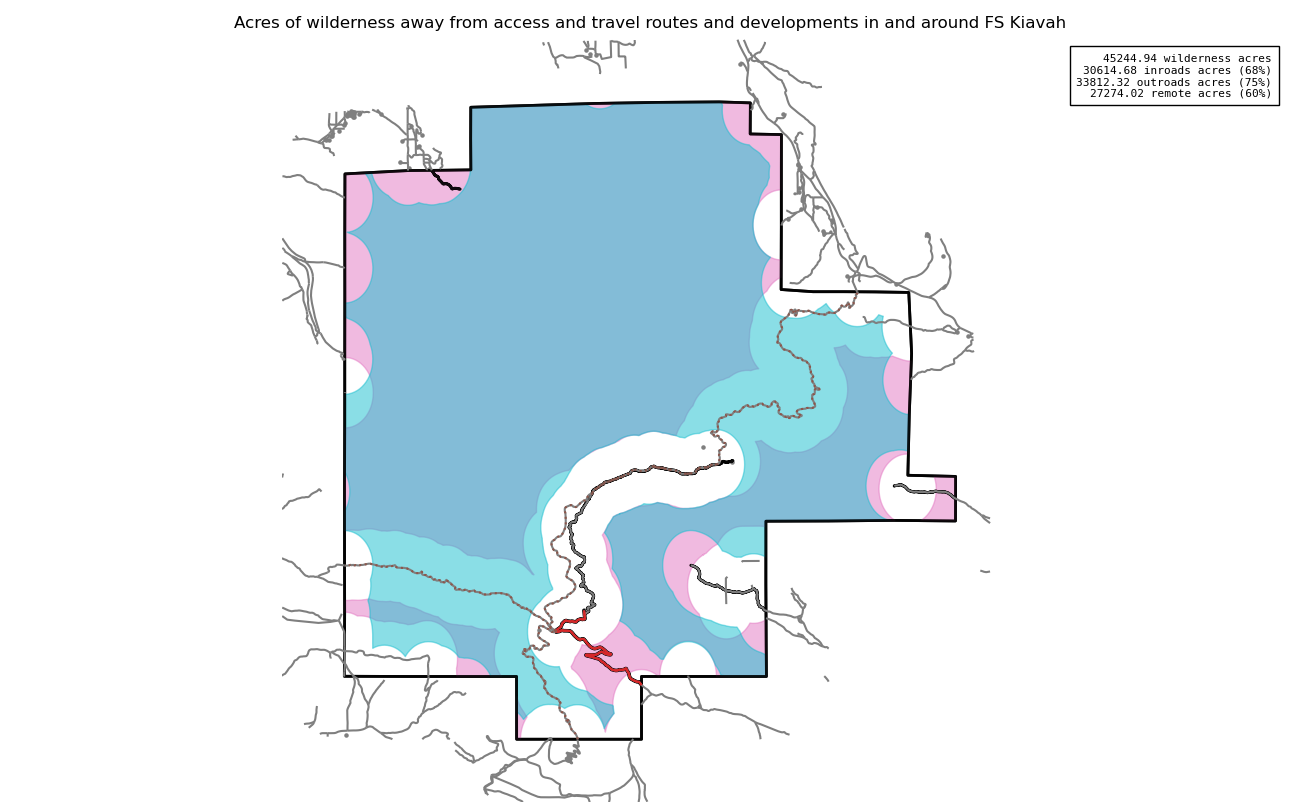
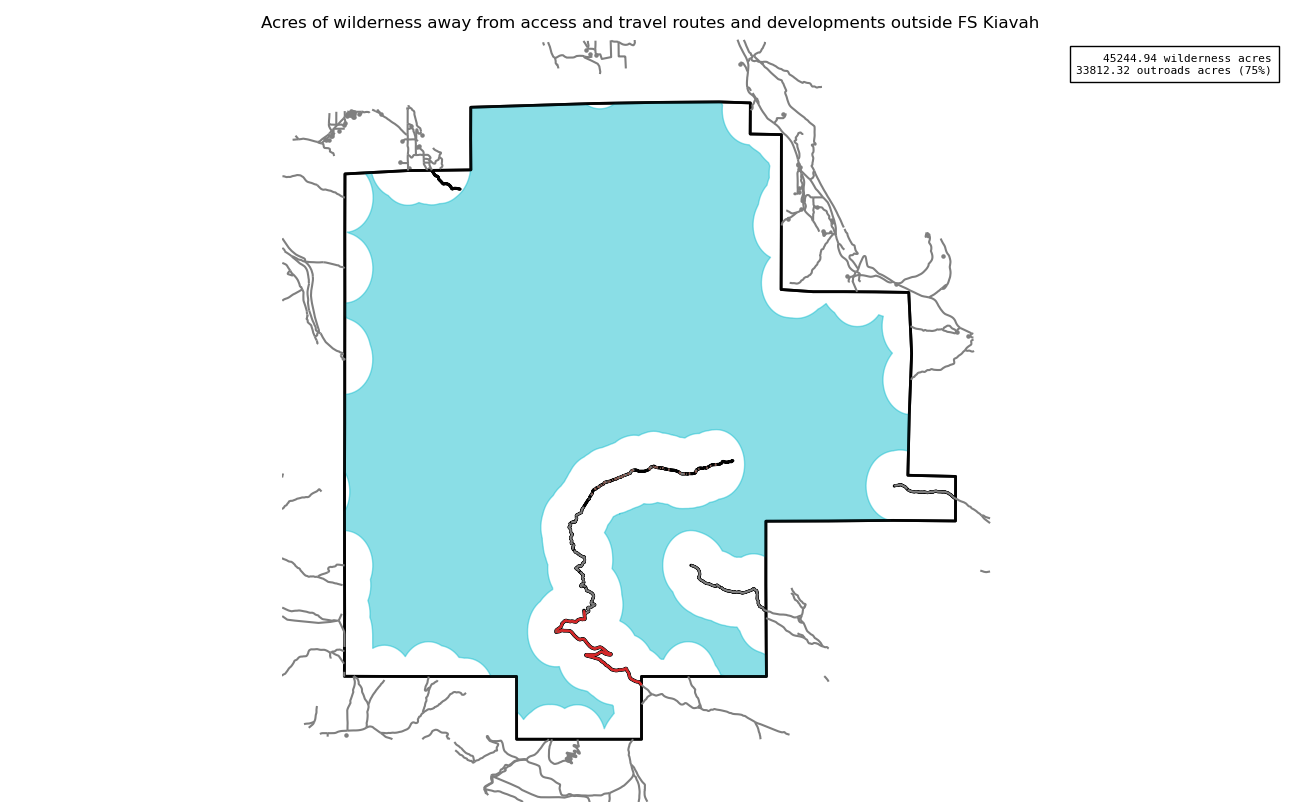
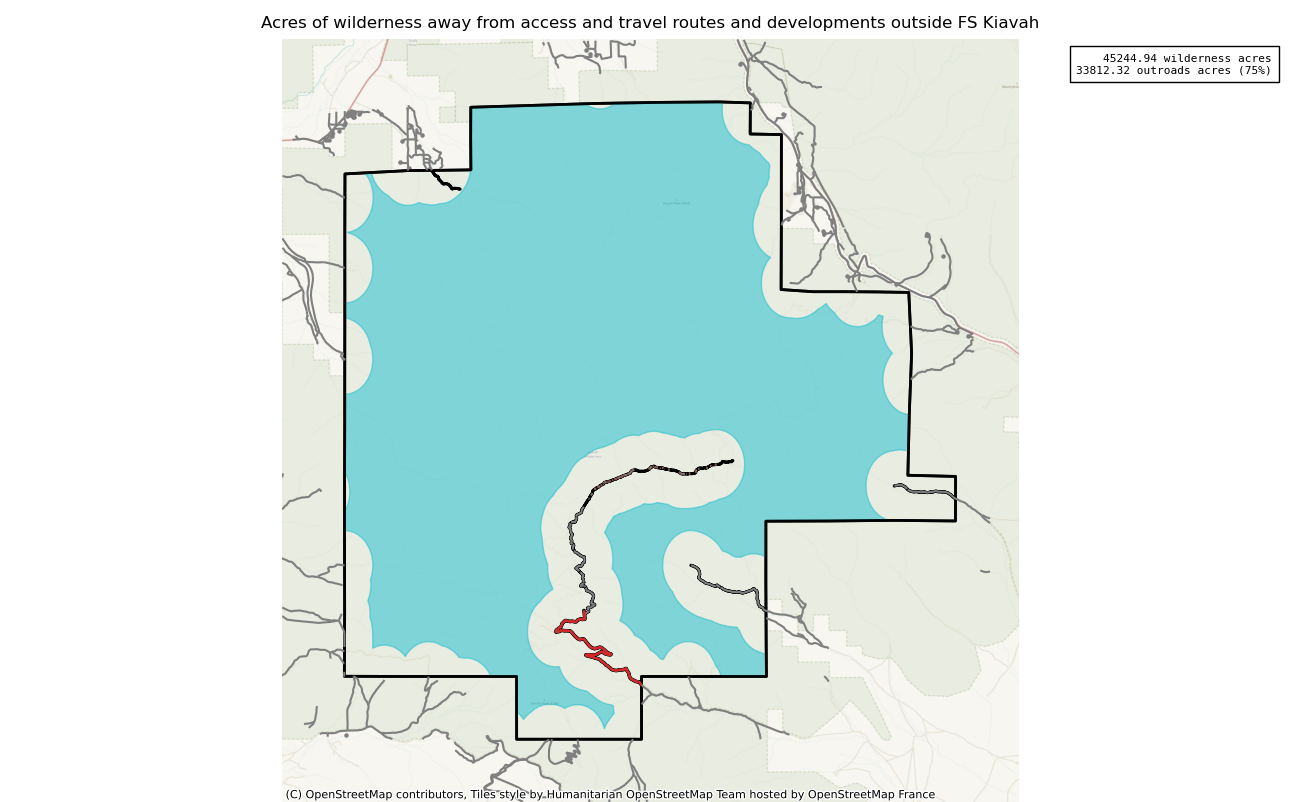
Acres of Wilderness Away from Adjacent Travel Routes and Developments Outside the Wilderness
Developments around the wilderness are available as kiavah-rem-out-devpt.json, kiavah-rem-out-devln.json, kiavah-rem-out-roadcore2.json, and kiavah-rem-out-trails.json.
Developments in and around the wilderness are available as kiavah_devpt.json, kiavah_devln.json, kiavah_roadcore2.json, and kiavah_trails.json.
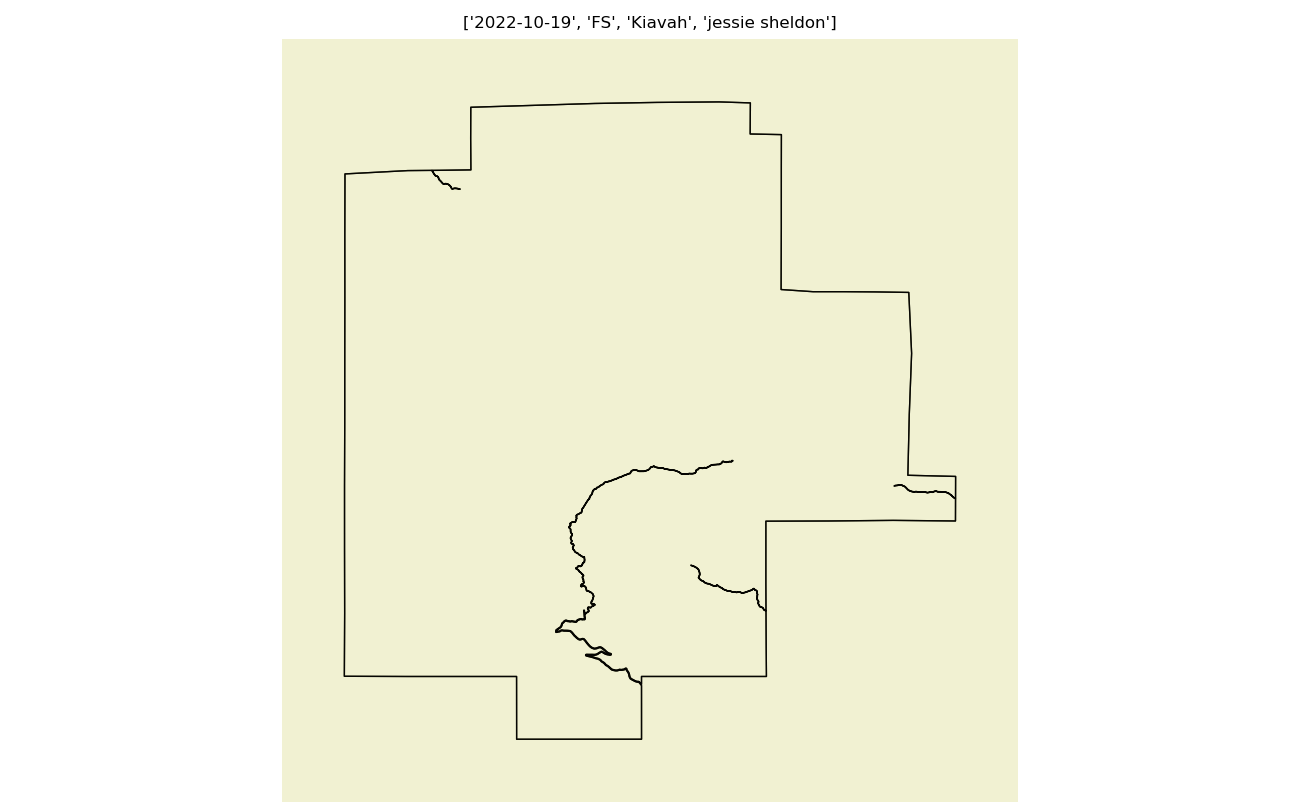
This measure assesses the total number of wilderness acres more than 1/2 mile from roads, structures, and other developments located outside a wilderness or on the boundary, including cherry-stemmed access road corridors and developed inholdings. Although legal protections and restrictions of wilderness do not extend to activities occurring outside a wilderness boundary, these activities can still degrade the wilderness experience. Signs of human activity and development outside wilderness manifest in many ways, including sounds from automobiles and off-highway vehicles on nearby travel routes, decreased visibility from air and light pollution, and visual evidence of increasing urbanization from high ridges and peaks.
Route and development data used in this analysis is from current USFS enterprise data, and should be verified locally before inclusion in any analysis. Corrections to this map reflecting deletions and additions to these may be required in any given year.
Note that roads and developments located exactly on the wilderness boundary are included in this measure. Spatial data resolution and accuracy can vary greatly across sources, and determining the intersection of a road represented by a single infinitely thin line can produce incorrect results. These should always be verified locally and corrected.
Once we have a reasonably accurate representation of developments around the wilderness, these are clipped to the wilderness boundary, buffered to half a mile, and these areas are subtracted from the total wilderness area. This initial acreage is the baseline value. The measure is recalculated using current data sources every five years to determine a trend.
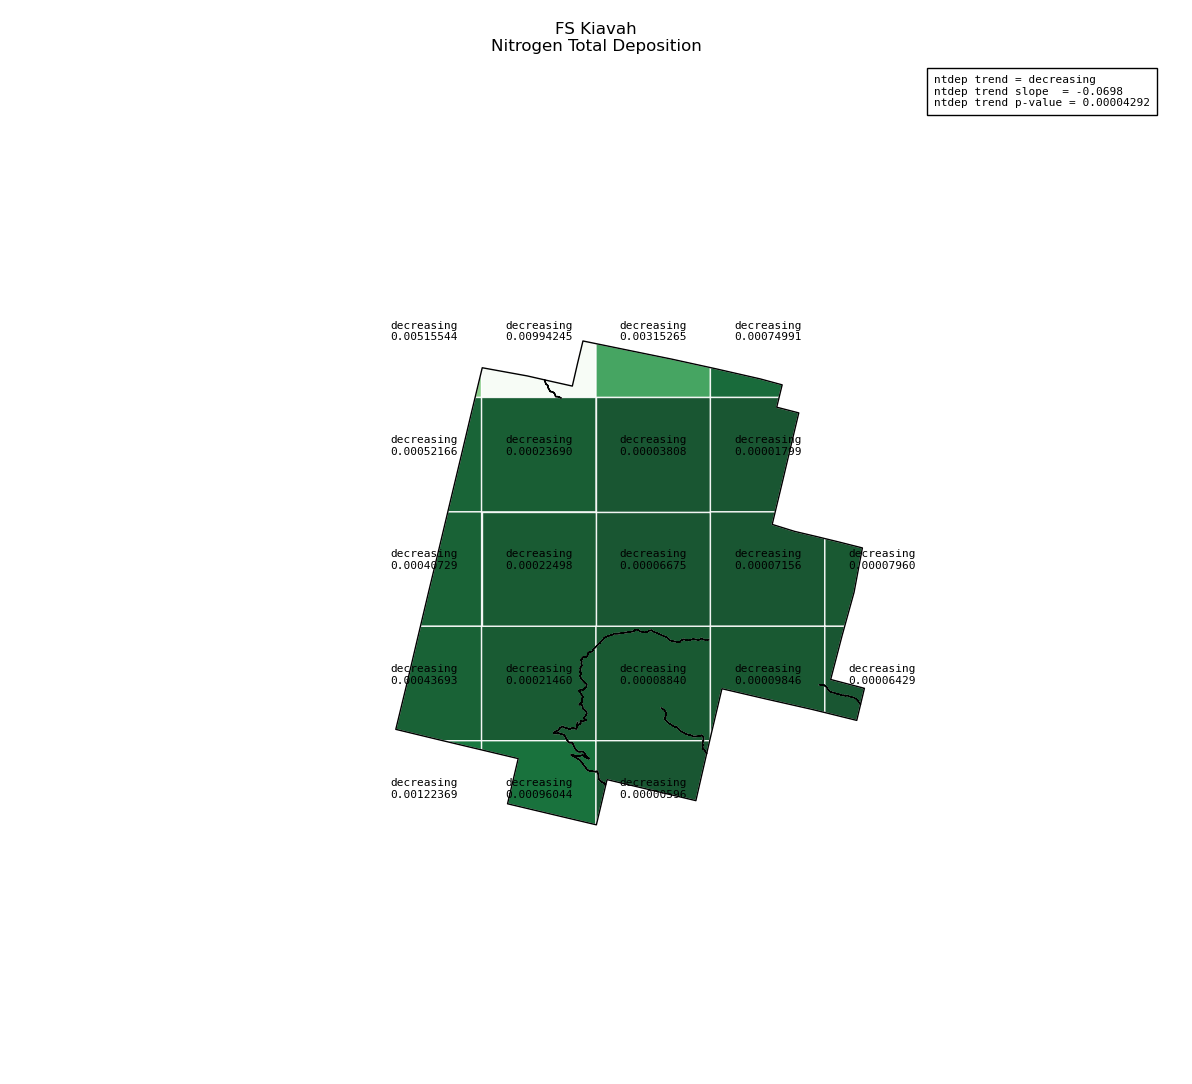
Total Deposition of Nitrogen
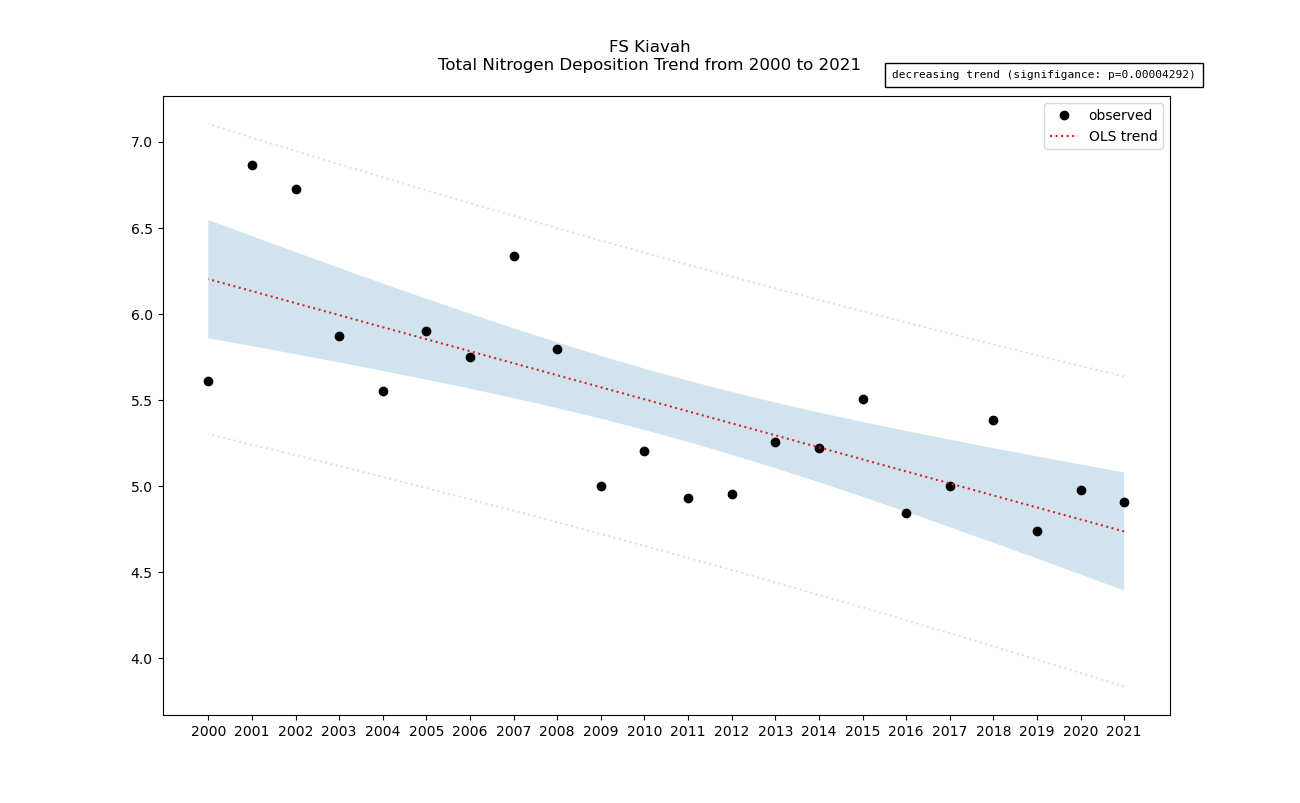
Average annual nitrogen total deposition values in the wilderness for 2000 through 2021 are listed in kiavah-ntdep.csv.
This wilderness area had no adequate nitrogen wet deposition data available at the time of this analysis.
Nitrogen oxides (NOX) are one of the major pollutants emitted into the atmosphere during the burning of fossil fuels. Agricultural activities, especially livestock management and fertilizer application to soils, are the primary source of ammonia (NH3) released to the atmosphere. These pollutants return to terrestrial and aquatic environments as atmospheric deposition of nitric acids and ammonium. These compounds can acidify soil and surface waters, which affects nutrient cycling, impacts the growth of vegetation, and causes the decline or death of aquatic insects and fish.
The best total nitrogen deposition values available in the lower 48 are the result of a hybrid approach that combines measured and modeled deposition into a continuous grid across the landscape. This approach combines monitoring data with output from the Community Multiscale Air Quality modeling system, giving priority to measurement data near the location of the monitor and priority to modeled data in areas where monitoring data are not available.
Annual averages for nitrogen total deposition are calculated by clipping the gridded ntdep data to the wilderness boundary, multiplying the total deposition value for each grid cell by its area inside the wilderness, summing ntdep for all cells, then dividing that sum by the total area of the wilderness. These annual averages are then used to determine nitrogen deposition trend inside the wilderness. Decreasing nitrogen deposition indicates an improvement in wilderness character.
In addition to total deposition, data for wet deposition of nitrogen is provided for some wilderness areas, primarily in the eastern side of the continent. Where available, wet deposition trends for each period from the initial year of monitoring plus five years and extended every five years to the current year are shown on the wet deposition trends graph in this section.
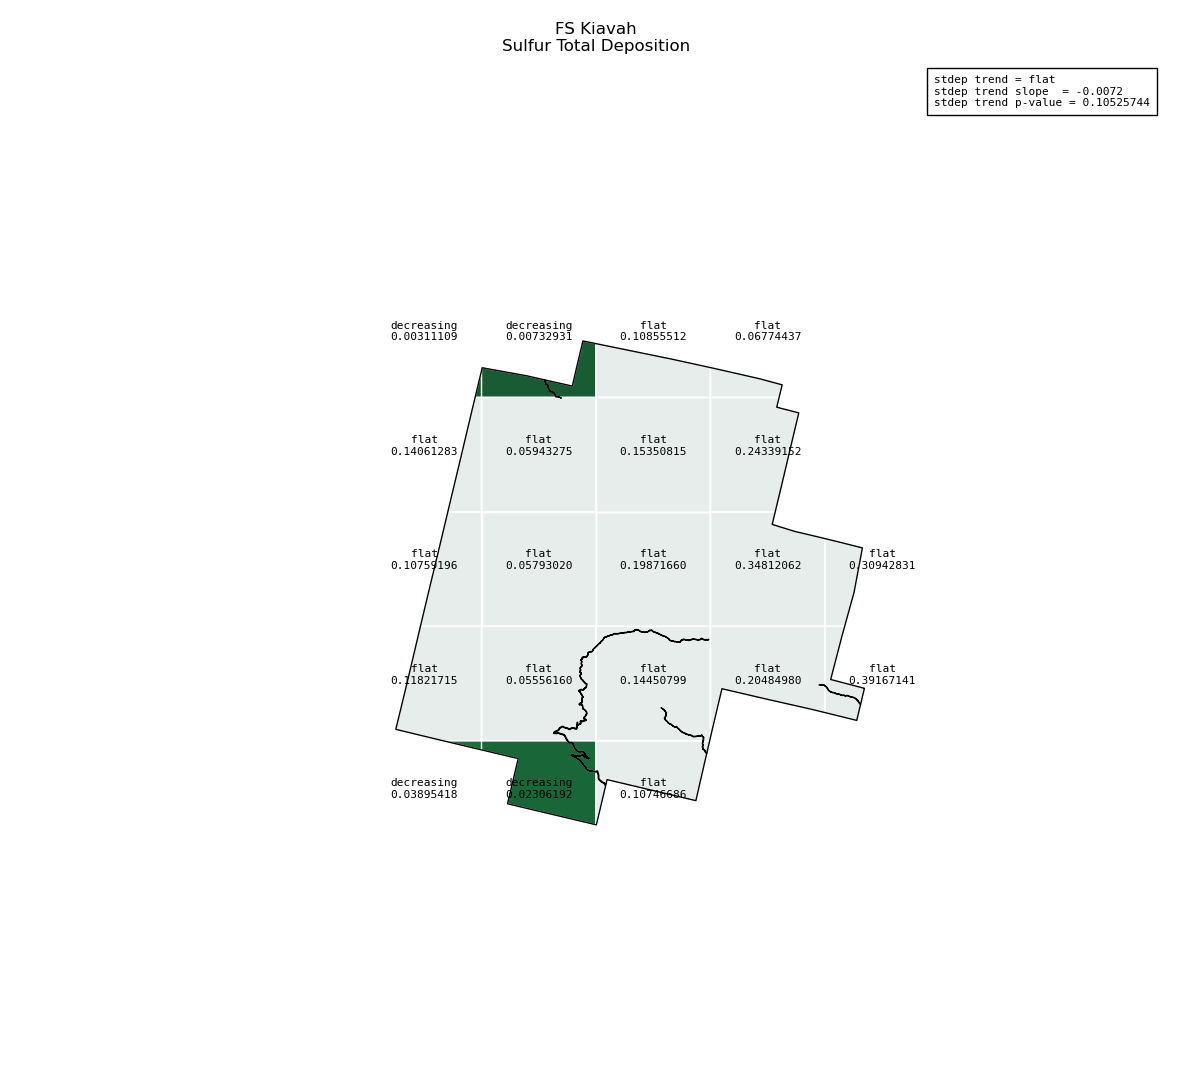
Total Deposition of Sulfur
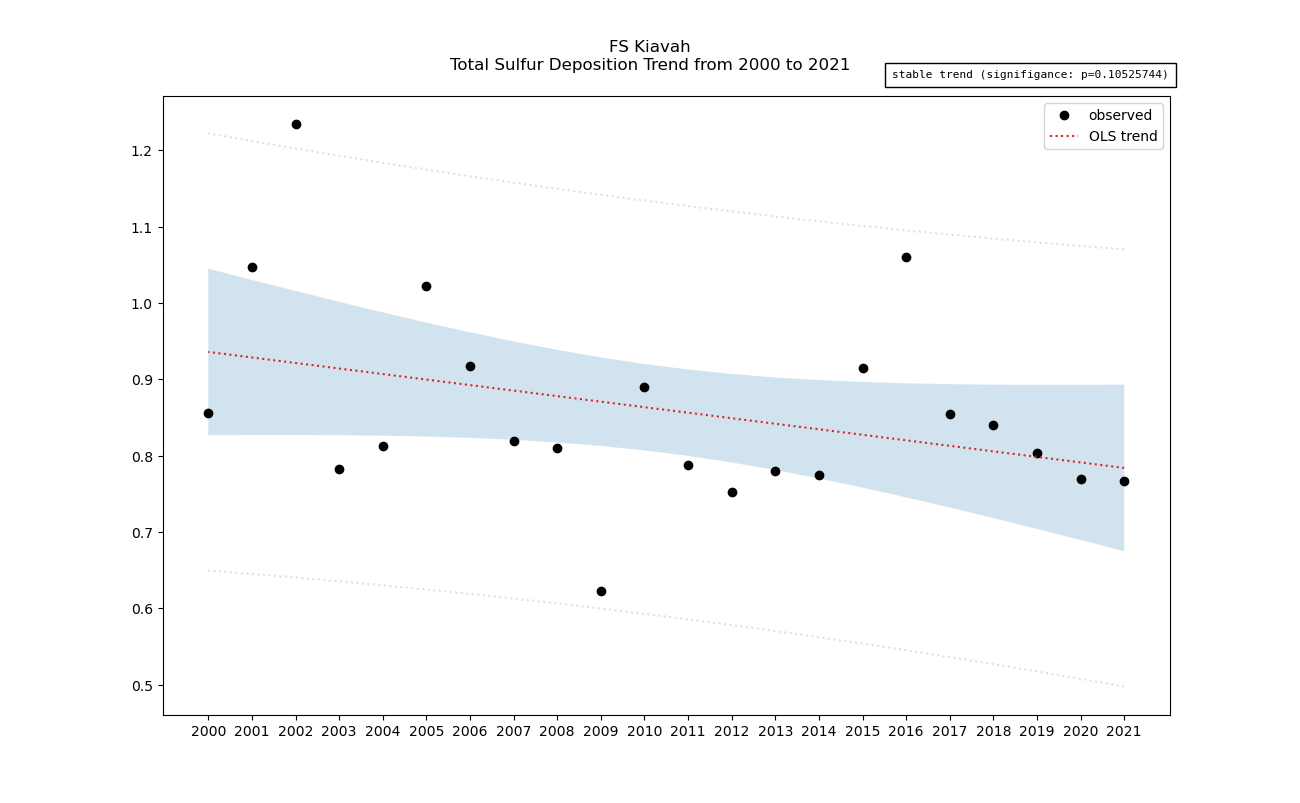
Average annual sulfur total deposition values in the wilderness for 2000 through 2021 are listed in kiavah-stdep.csv.
This wilderness area had no adequate sulfur wet deposition data available at the time of this analysis.
Sulfur dioxide (SO2) is emitted during the burning of fossil fuels, especially coal, and can be transported long distances through the atmosphere before being deposited in the form of sulfuric acid. In sensitive ecosystems, sulfuric acid can contribute to acidification of soil and surface waters, affect nutrient cycling and impact the growth of vegetation, as well as lead to the decline and death of aquatic insects and fish. These effects have been more prevalent in the eastern United States due to historically high sulfur deposition levels. Although sulfur deposition has been declining and fish kills from acidification are now infrequent, sulfur bound and held in the soil continues to affect soil chemistry, soil buffering capacity, and the nutrient status of soils.
Eastern National Forests are likely to be more interested in using the sulfur deposition measure over the nitrogen measure because sulfur continues to exert a stronger influence on many ecosystems in the Eastern United States.
The best total sulfur deposition values available in the lower 48 are the result of a hybrid approach that combines measured and modeled deposition into a continuous grid across the landscape. This approach combines monitoring data with output from the Community Multiscale Air Quality modeling system, giving priority to measurement data near the location of the monitor and priority to modeled data in areas where monitoring data are not available.
Annual averages for sulfur total deposition are calculated by clipping the gridded stdep data to the wilderness boundary, multiplying the total deposition value for each grid cell by its area inside the wilderness, summing stdep for all cells, then dividing that sum by the total area of the wilderness. These annual averages are then used to determine sulfur deposition trend inside the wilderness. Decreasing sulfur deposition indicates an improvement in wilderness character.
In addition to total deposition, data for wet deposition of sulfur is provided for some wilderness areas, primarily in the eastern side of the continent. Where available, wet deposition trends for each period from the initial year of monitoring plus five years and extended every five years to the current year are shown on the wet deposition trends graph in this section.
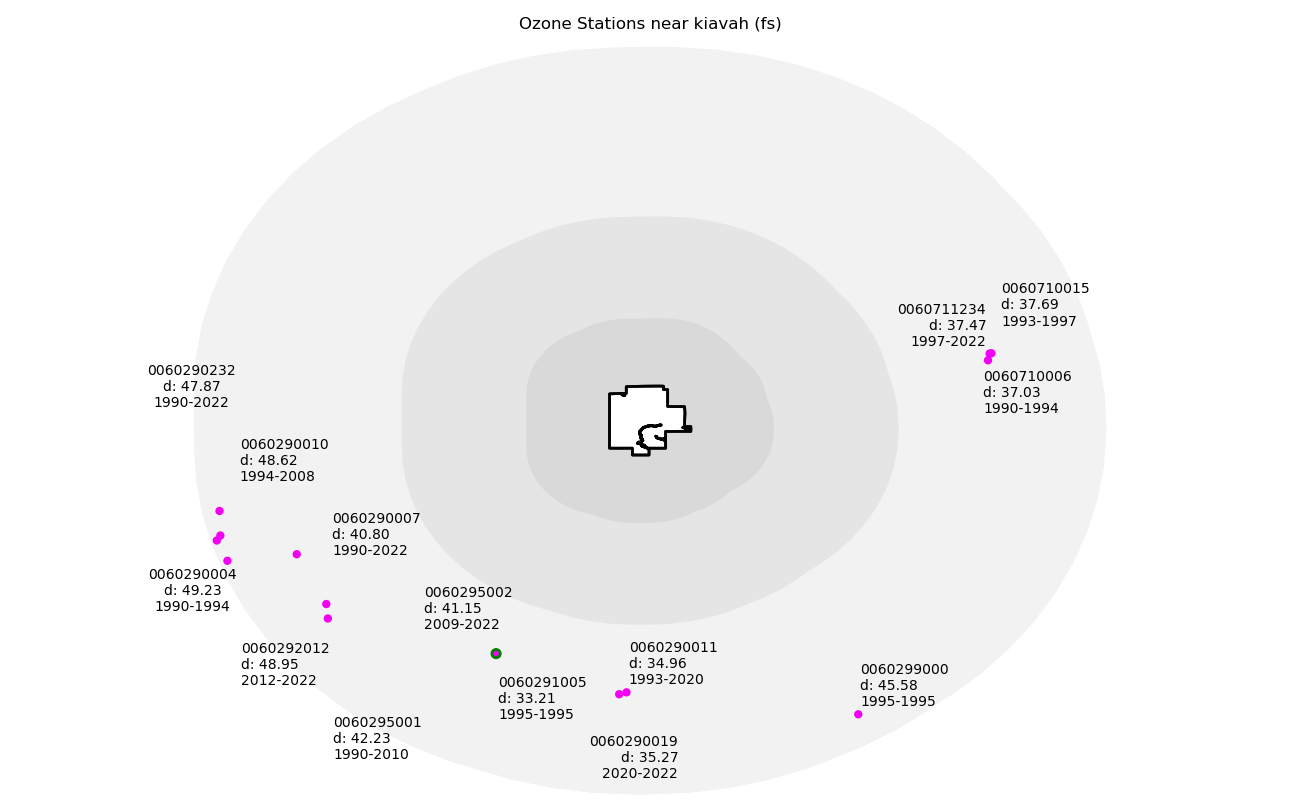
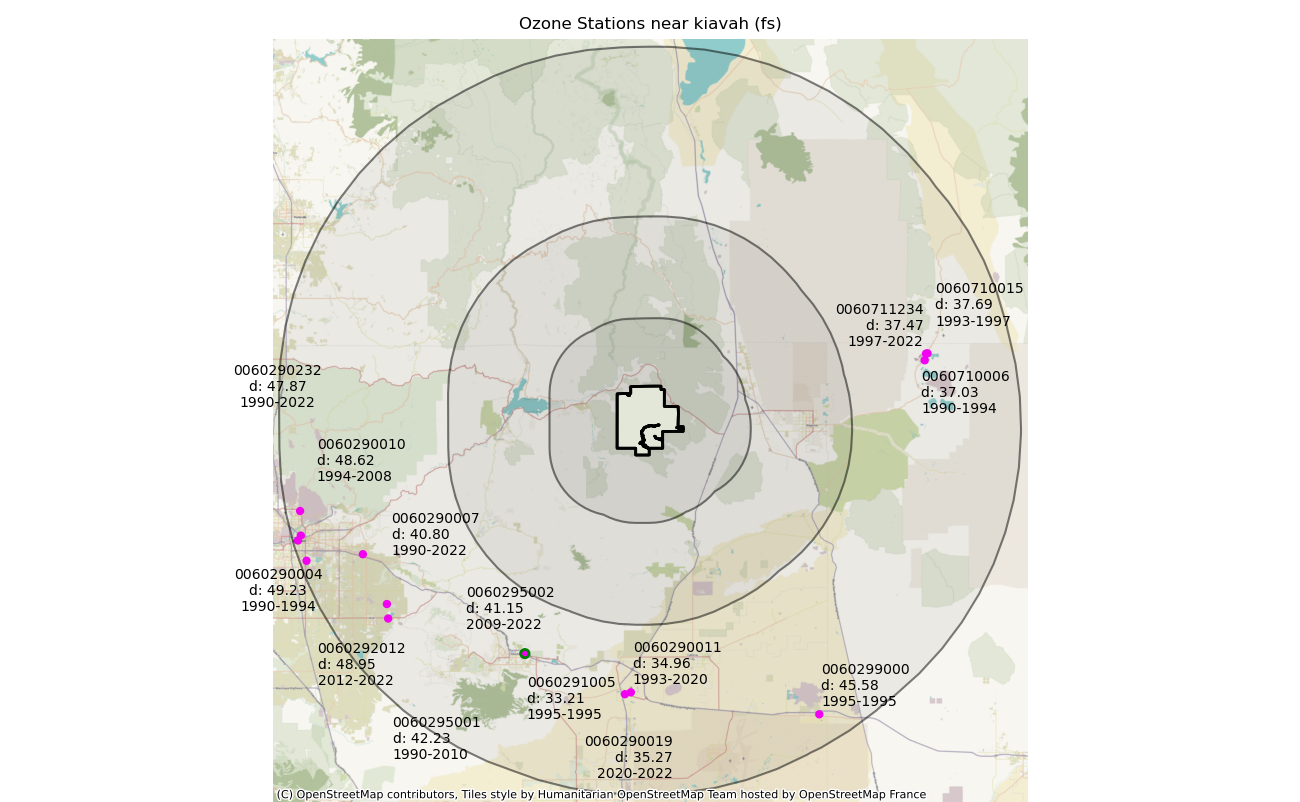
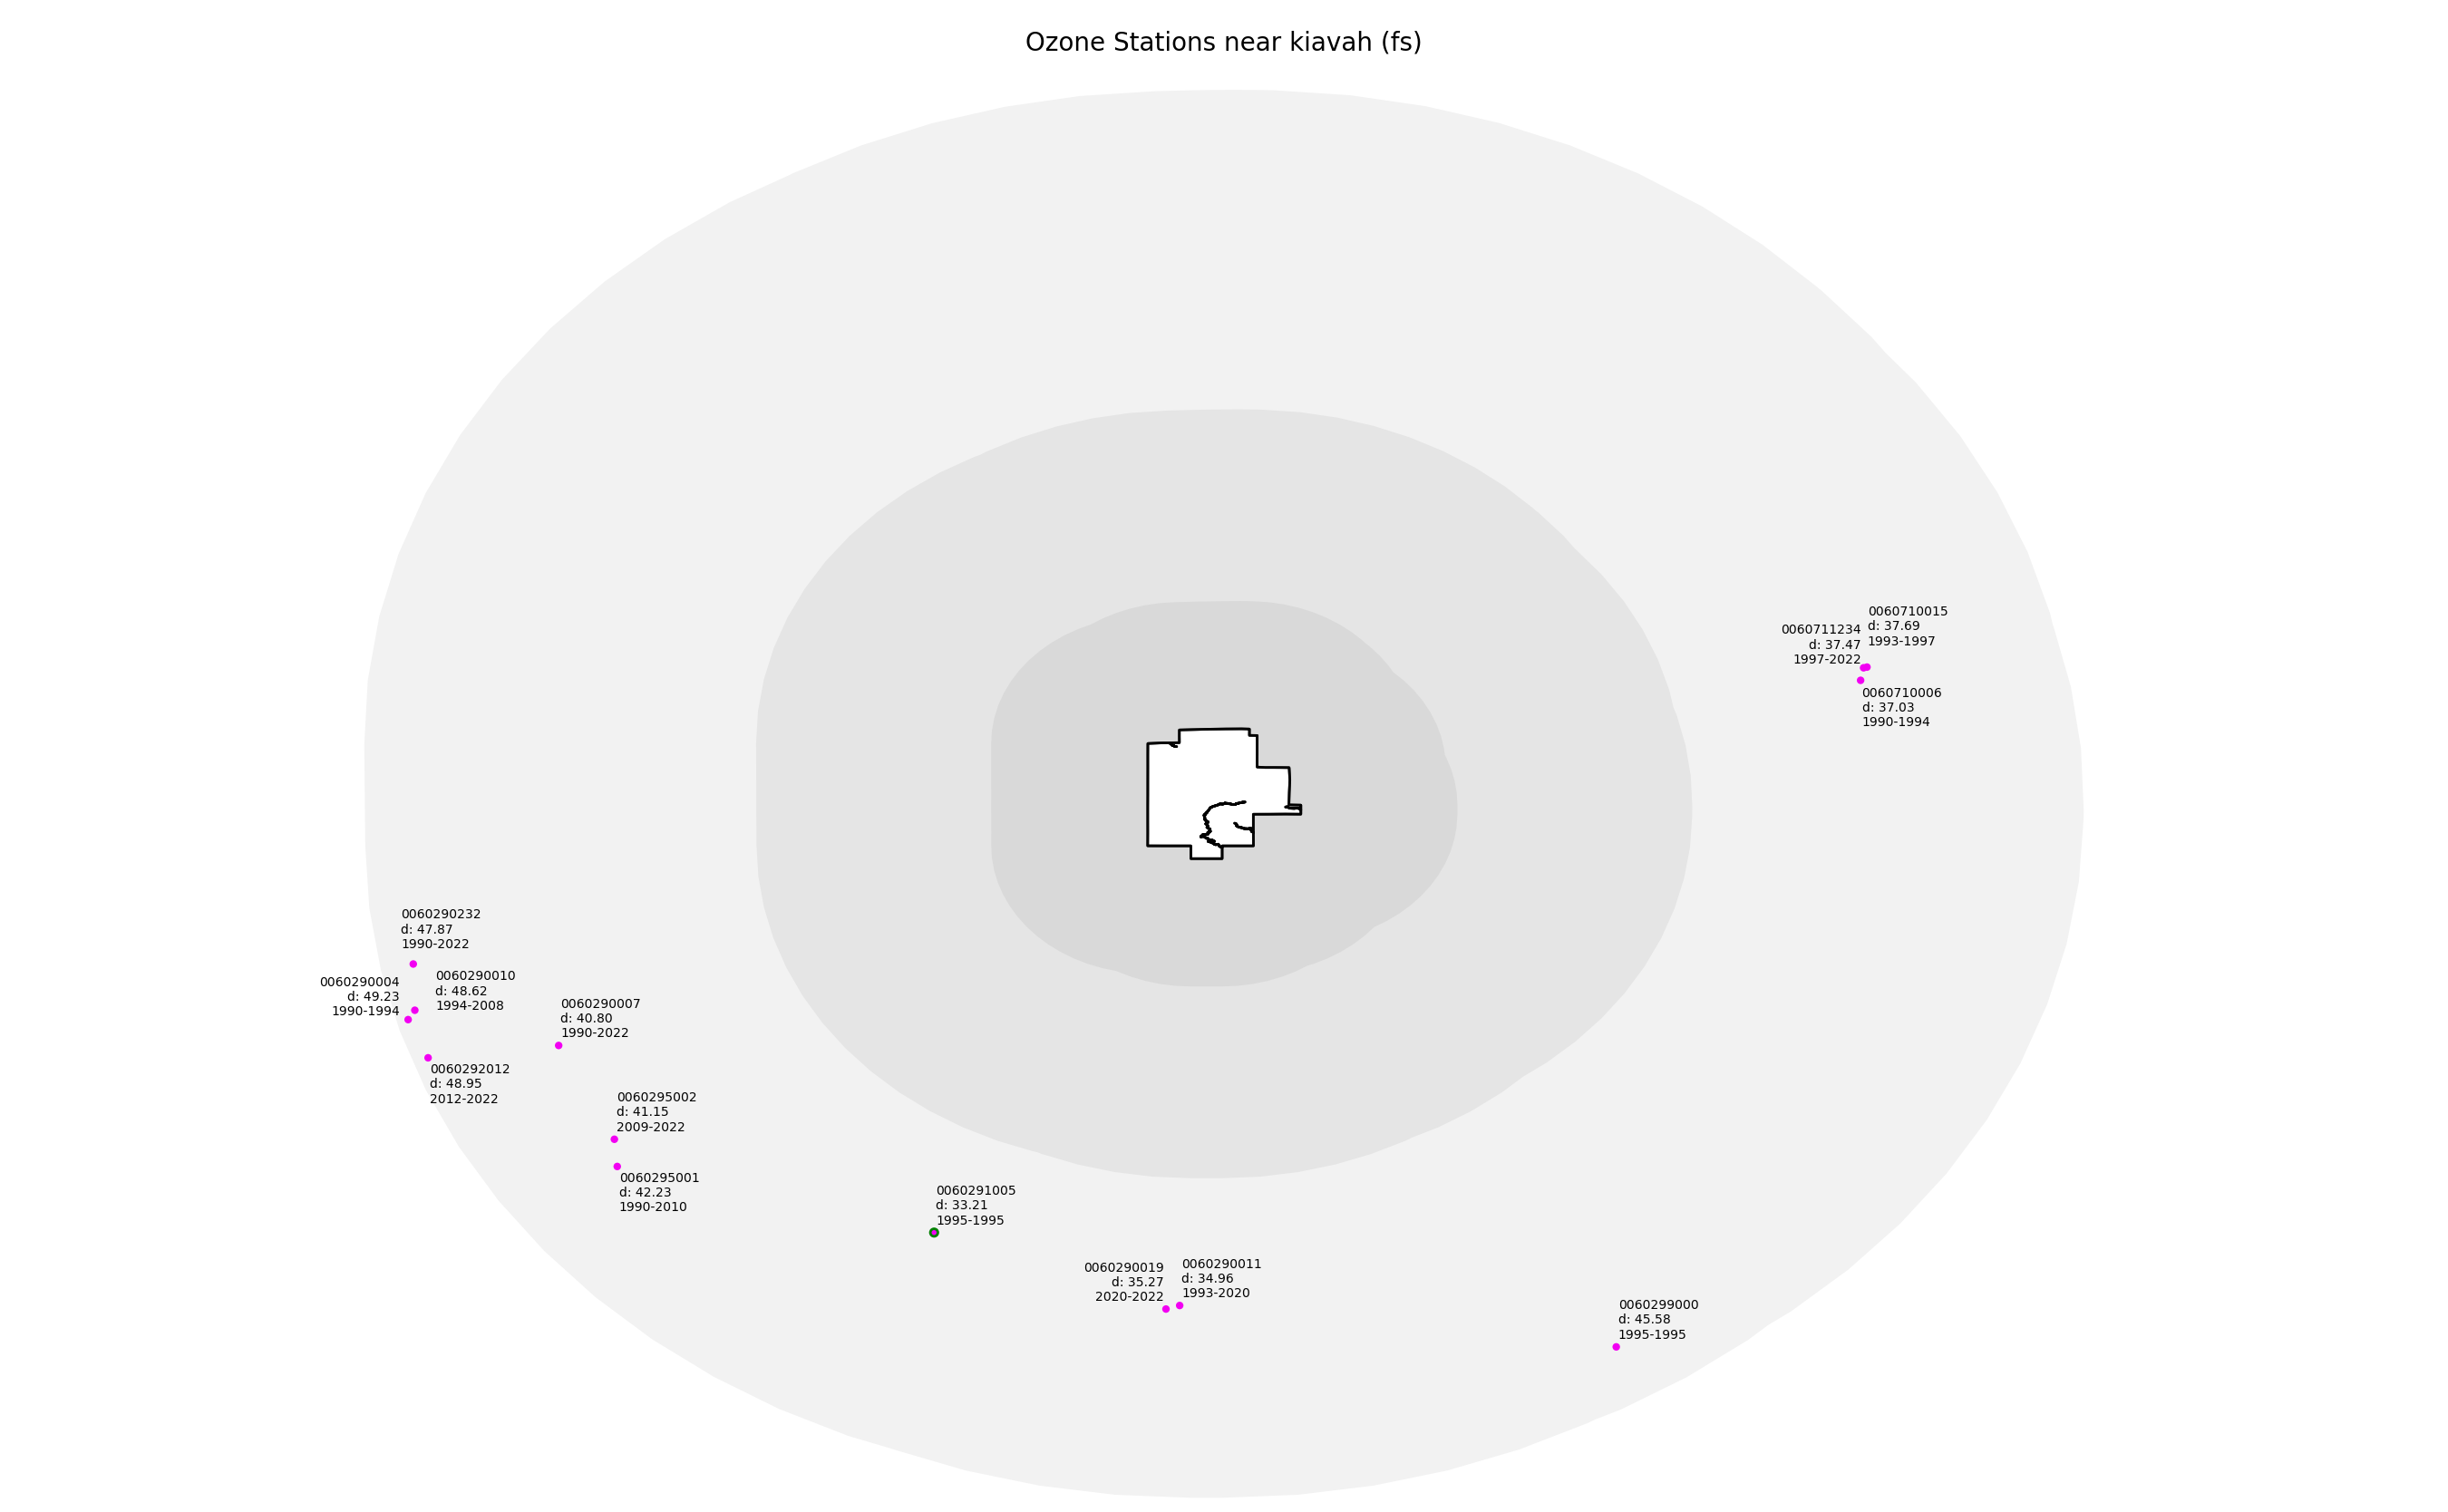
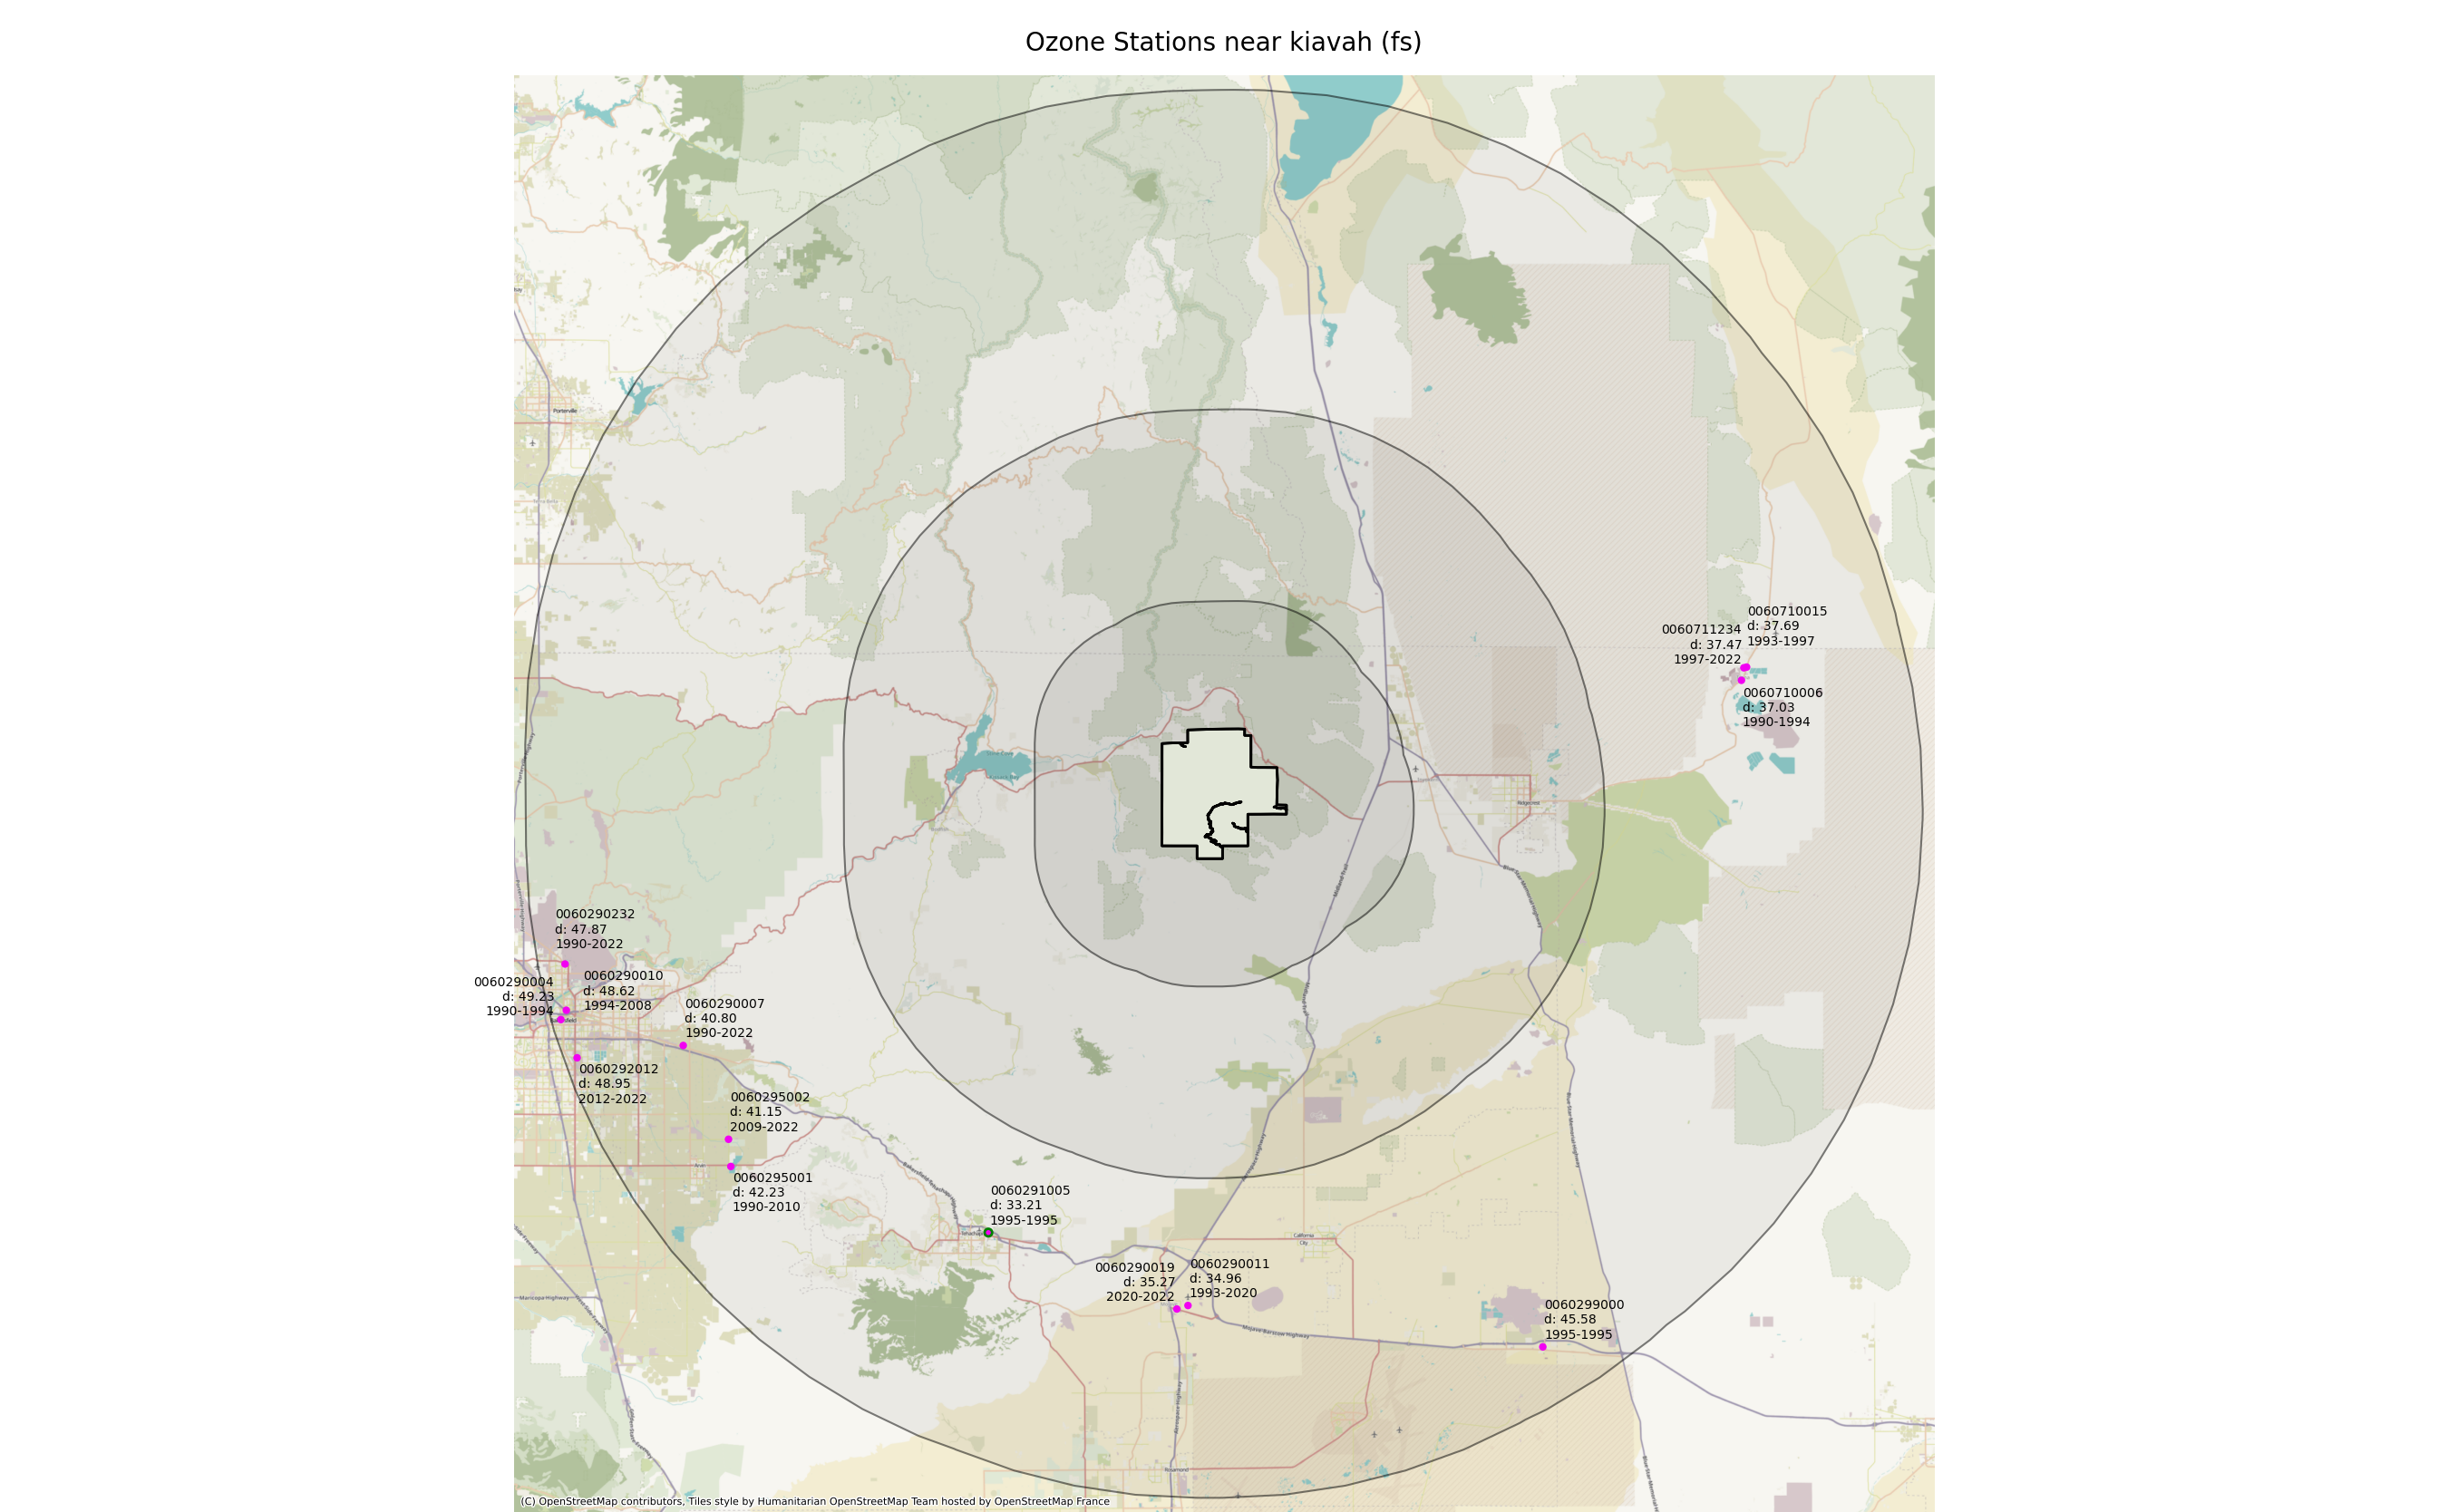
Concentration of Ambient Ozone
This wilderness area had no adequate ozone data available at the time of this analysis -- there is no nearby ozone station with enough data to show a trend.
Ozone is a pollutant formed when emissions of nitrogen oxides (NOX) and volatile organic compounds react in the presence of sunlight. Burning of fossil fuels and industrial processes produce these pollutants, which can then travel long distances resulting in elevated ozone levels in wildernesses. Ozone is one of the most toxic air pollutants to plants and its effects include visible injury to leaves and needles, premature leaf loss, reduced photosynthesis, and reduced growth in sensitive plant species. Continued exposure of vegetation to ozone over time may also result in increased susceptibility to disease and damage from insects, as well as changes in species diversity and community structure.
This measure assesses the 3-year rolling average of ozone concentration (fourth highest daily maximum 8-hour concentration) based on annual analyses of national ozone monitoring data.
Monitoring data from sites located within 25 miles of a wilderness boundary are generally considered representative. Only ozone data from 1990 forward are considered valid for this measure, so the earliest 3-year moving average used for any wilderness should be 1992. Period of record otherwise begins at the year of wilderness designation. A wilderness designated in 2000, for example, would use data from 2000, and the first 3-year average would be from 2002. Not all ozone monitoring sites have legacy data dating from the year of designation, in which case the baseline trend uses the ozone data when monitoring began.
A statistically significant decreasing trend in the 3-year rolling average of the fourth highest 8-hour ozone concentration results in an improving trend in the measure.
Index of Sensitive Lichen Species
This wilderness area had no adequate lichen plot data available at the time of this analysis.
Lichens are important contributors to critical ecosystem processes, such as nutrient cycling, and they provide food and nesting material for birds and other animals. Lichen communities that grow on trees (called 'epiphytic' species) rely completely on atmospheric sources of nutrition, and are a well-known biological indicator of air pollution in forested ecosystems. The presence or absence of sensitive lichens over time indicates improving or degrading air quality.
This measure assesses the trend in air pollution scores for nitrogen and sulfur derived from the presence and abundance of sensitive lichen species, based on analyses of local biomonitoring data. Air pollution scores are calculated for each wilderness biomonitoring plot by surveying epiphytic lichen species with varying sensitivities to nitrogen and sulfur air pollution.
Once air scores for all plots are obtained, these are averaged across years. The earliest field collection date after the year of wilderness designation are compared to the most recent field collection date to complete this analysis. In instances where a wilderness has multiple sampling dates across a 10-year period, values from the earliest 10-year period can be compared with the most recent 10-year period.
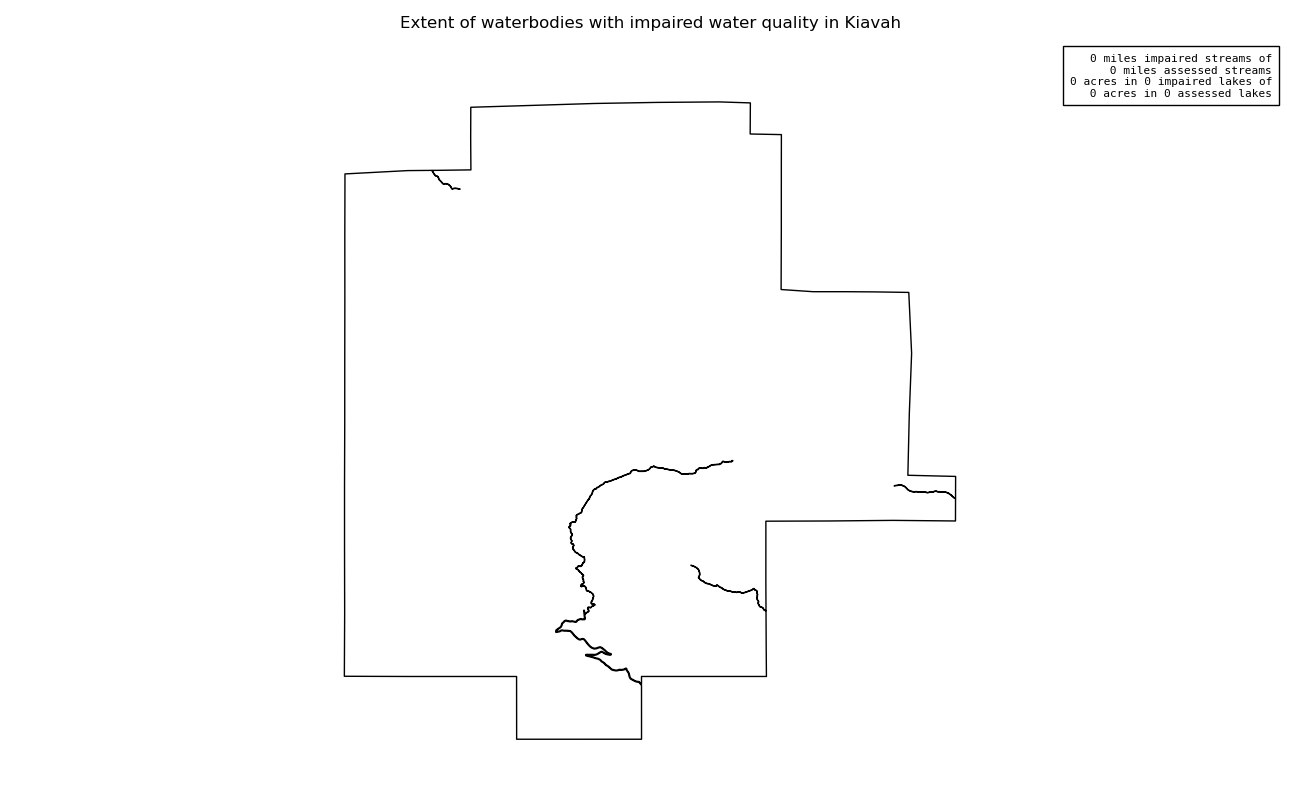
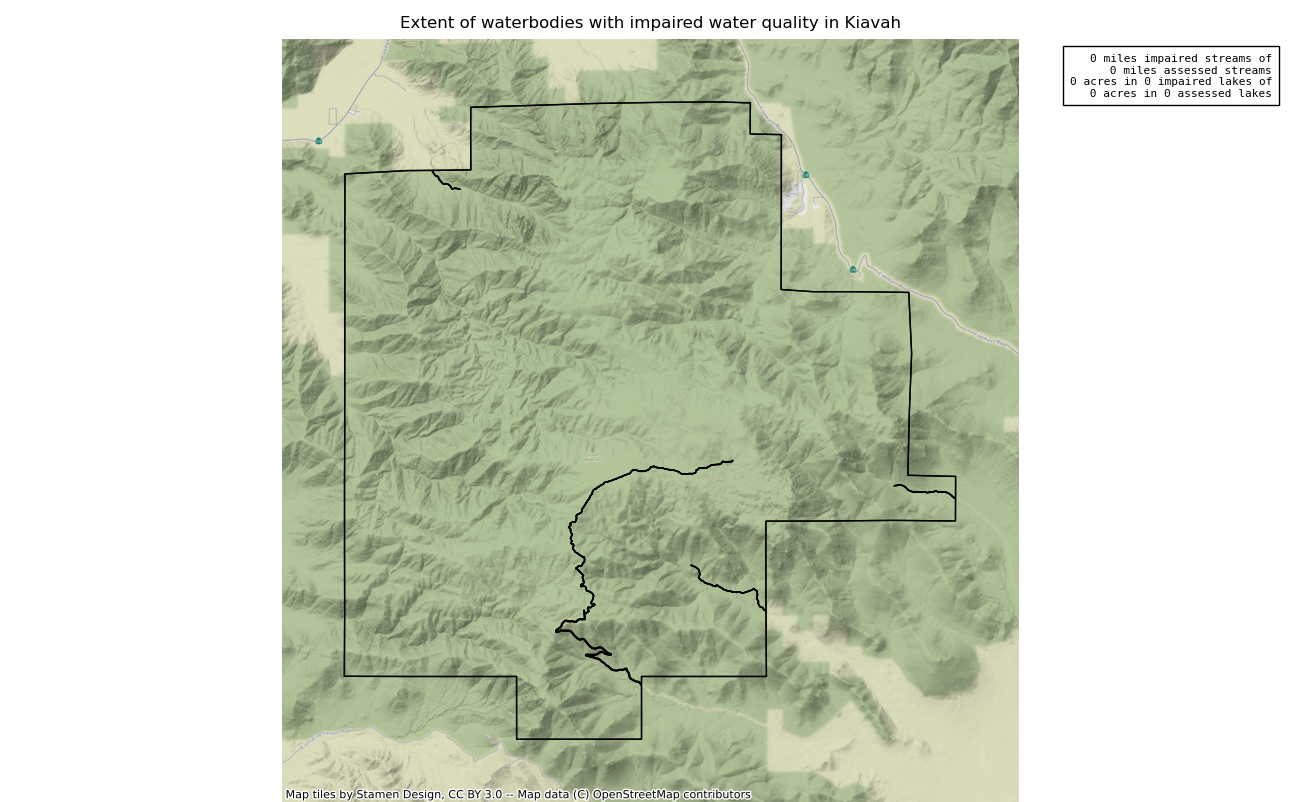
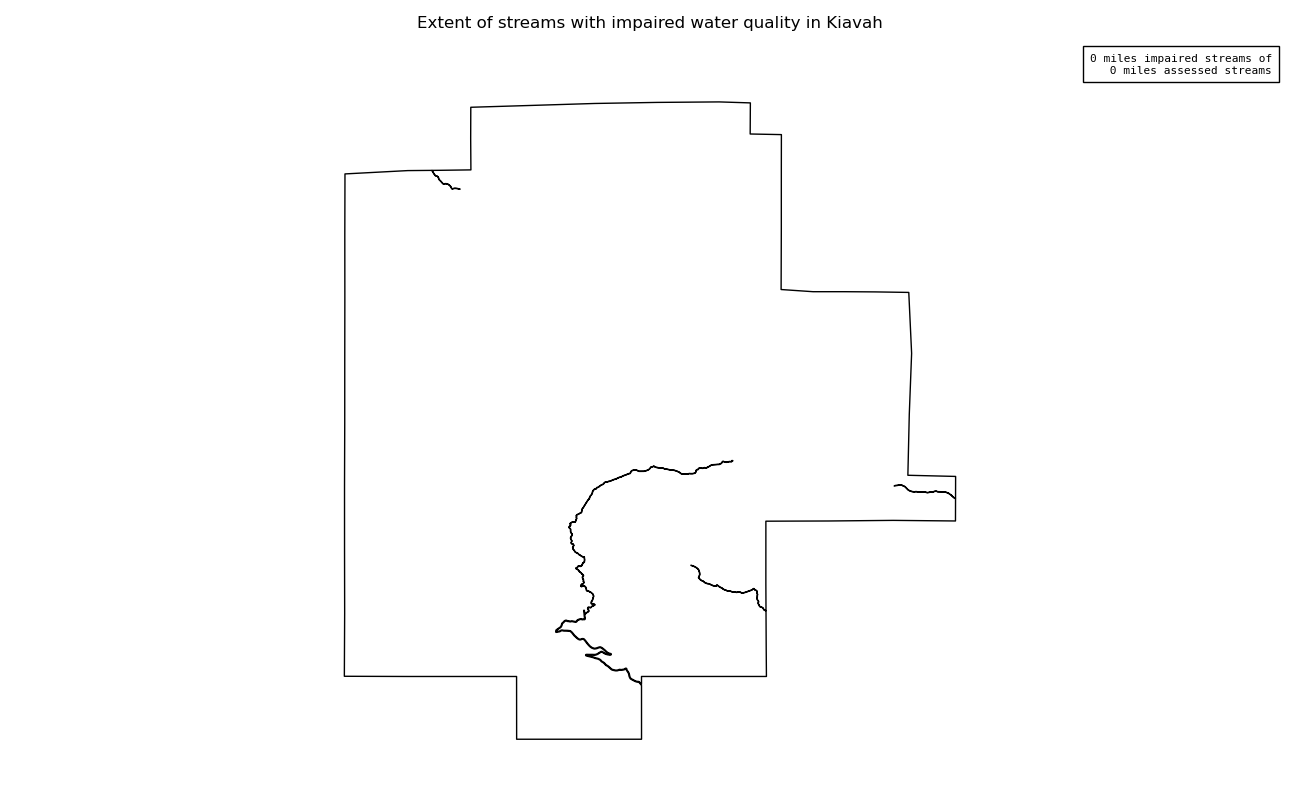
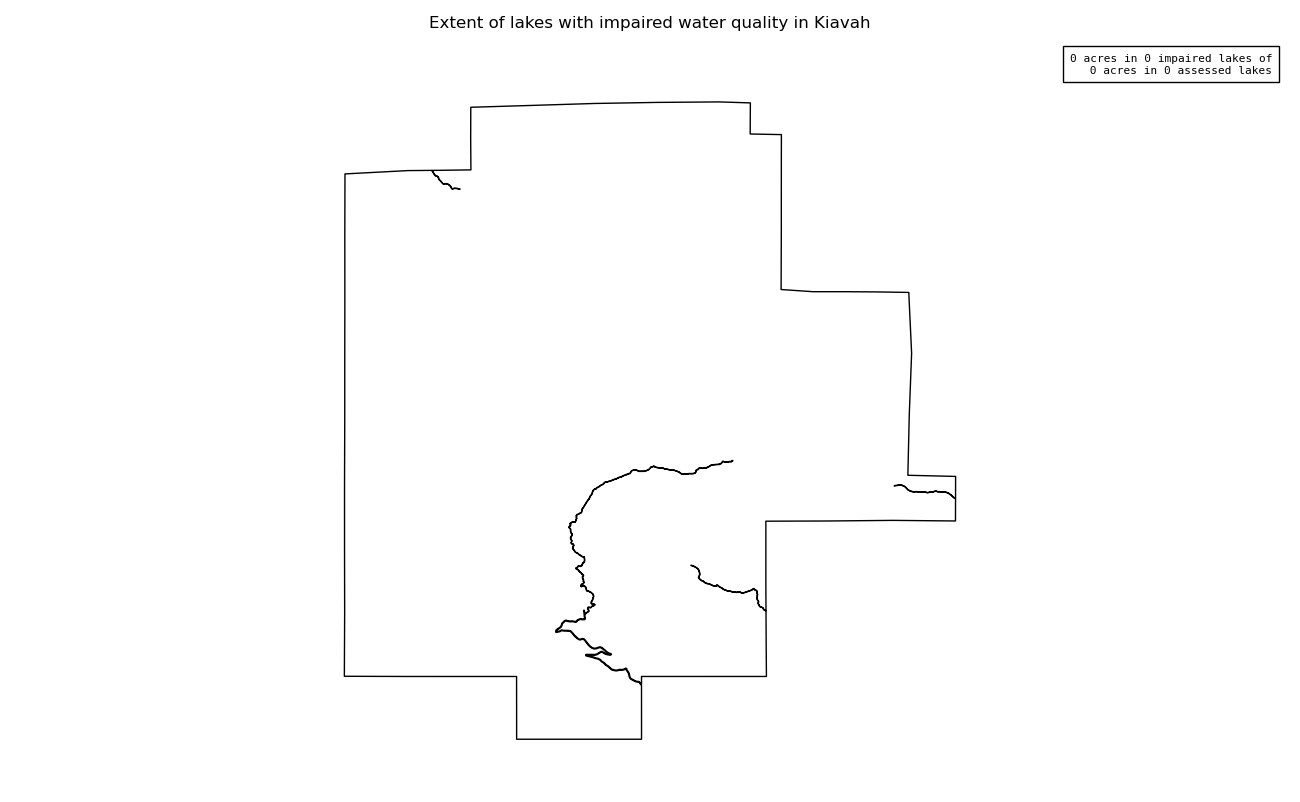
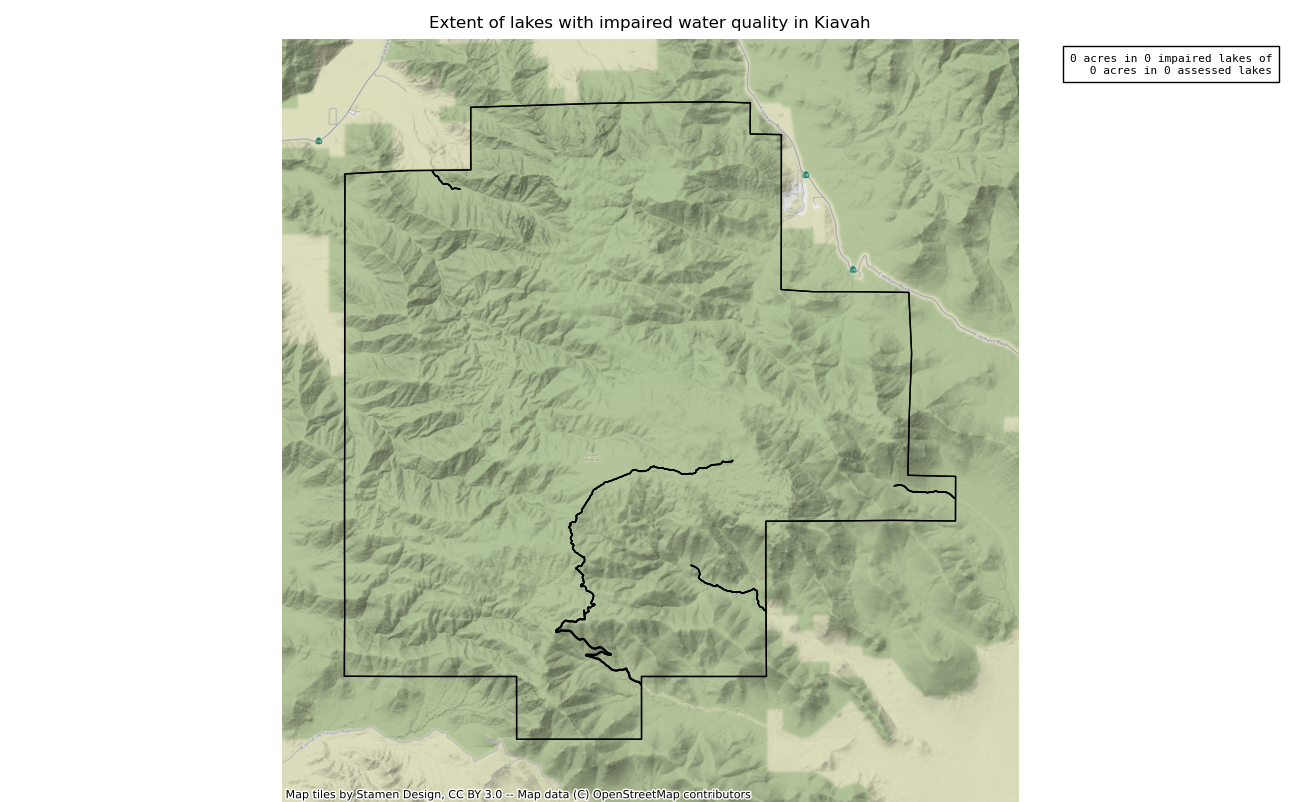
Extent of Waterbodies with Impaired Water Quality
Each assessed stream in the wilderness along with its mileage inside the wilderness and impairment level is listed in kiavah-ln_in_groups.csv. Each assessed lake in the wilderness along with its impairment level is listed in kiavah-pl_in_groups.csv.
This measure assesses the miles of streams or number of lakes inside wilderness with impaired water quality, based on national or state 303(d) list of impaired water bodies or local monitoring data. Water quality directly influences the health of plant and animal communities. While many headwater wilderness watersheds have good water quality, degradation from historical activities such as mining or from upstream developments outside a wilderness may impact water quality in wilderness.
Like other measures based on current spatial data, this measure is recalculated using current data every five years to determine a trend.
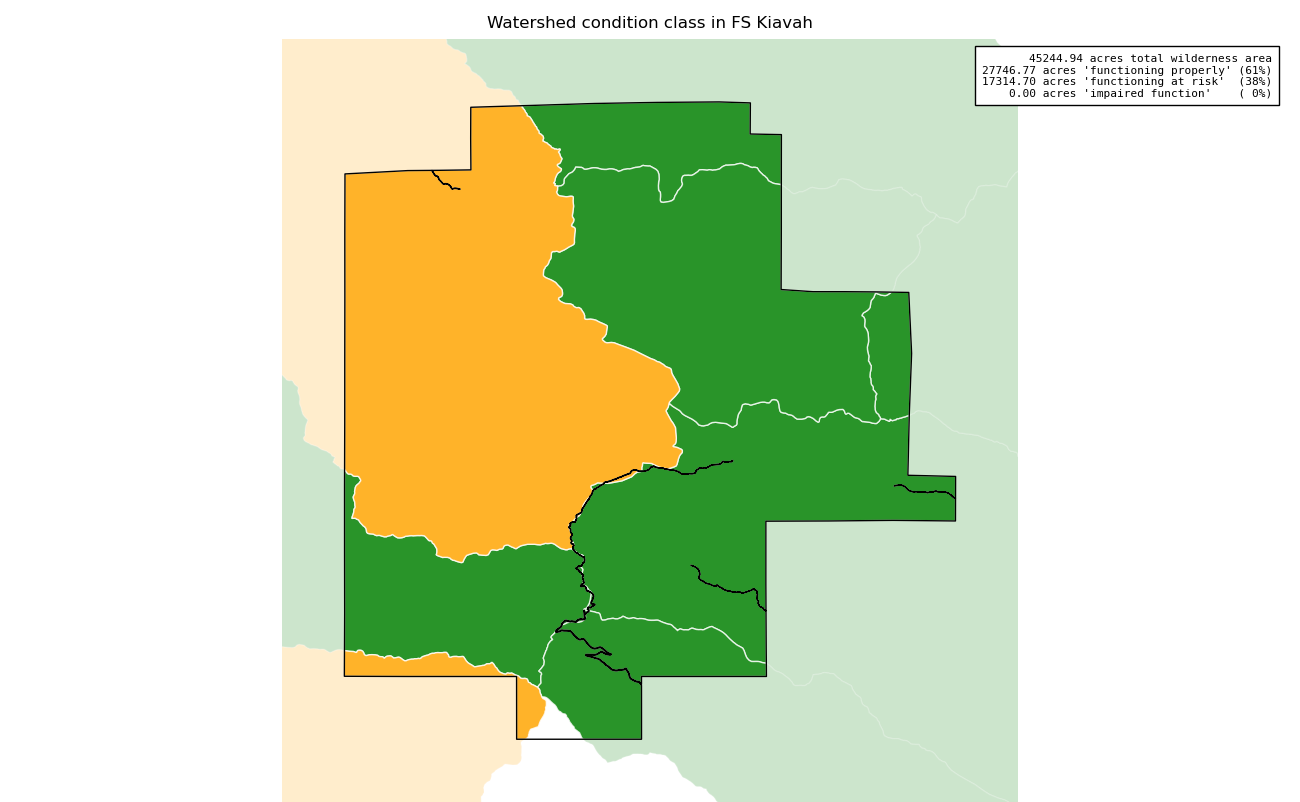
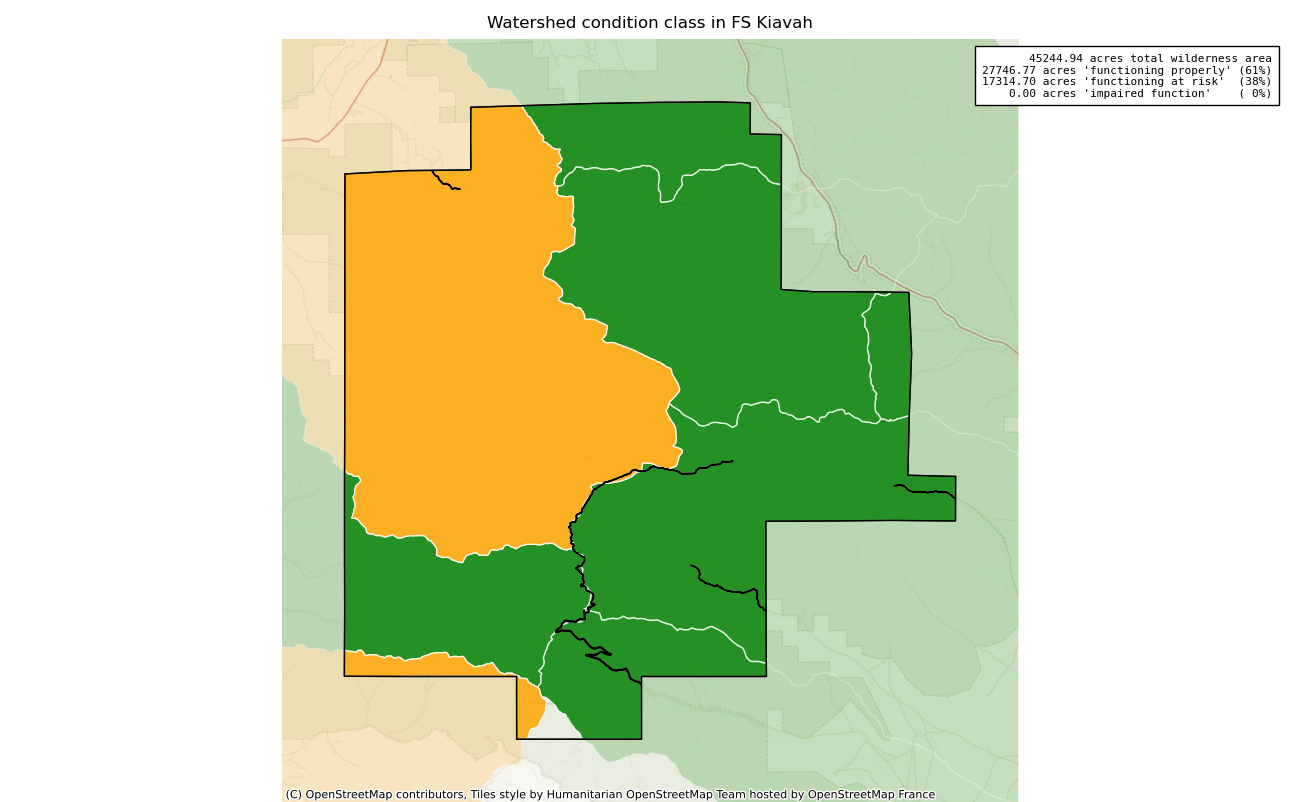
Watershed Condition Class
Each watershed in the wilderness along with its watershed condition class and the acres of that watershed falling inside the wilderness are listed in kiavah-wcc.csv.
The Watershed Condition Class measure is intended to monitor changes in the watershed functions supporting aquatic ecosystems inside the wilderness. USFS Watershed Condition Class is derived from 12 different indicators -- water quality, water quantity, aquatic habitat, aquatic biota, roads and trails, soils, riparian/wetland vegetation, fire regime or wildfire, forest cover, rangeland vegetation, terrestrial invasive species, and forest health -- resulting in a single score describing watershed integrity for each watershed:
- Class 1: 'Functioning properly'
- Class 2: 'Functioning at risk'
- Class 3: 'Impaired function'
Like other measures based on current spatial data, the initial percentages are the baseline, and these are recalculated every five years to determine a trend.